The Canadian market has stalled recently at an important resistance level. 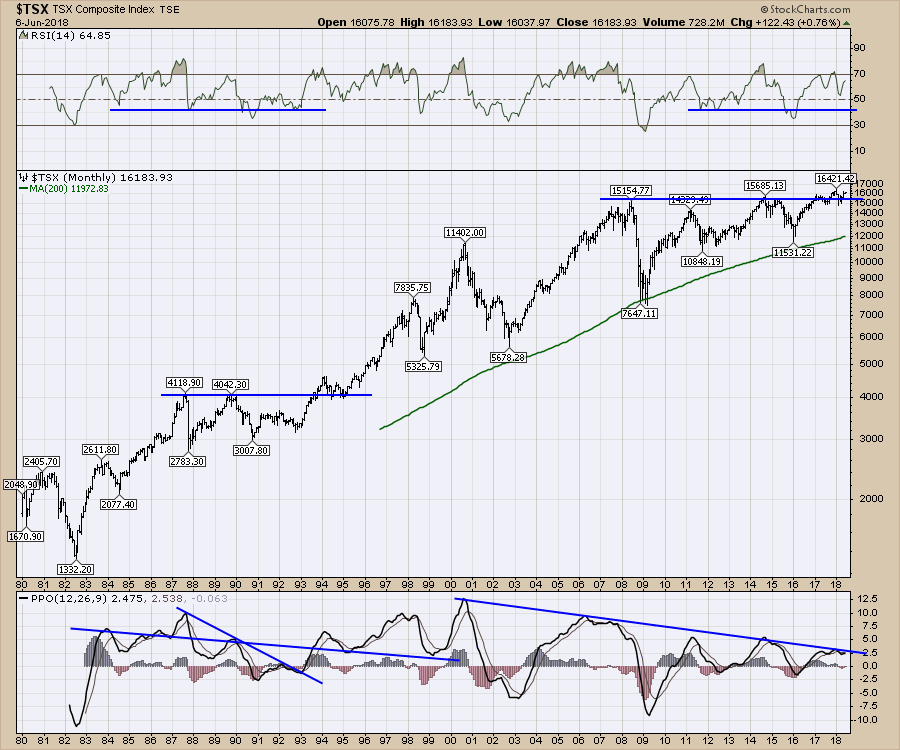
A breakout on the momentum line would be a big help to see Canada start to outperform.
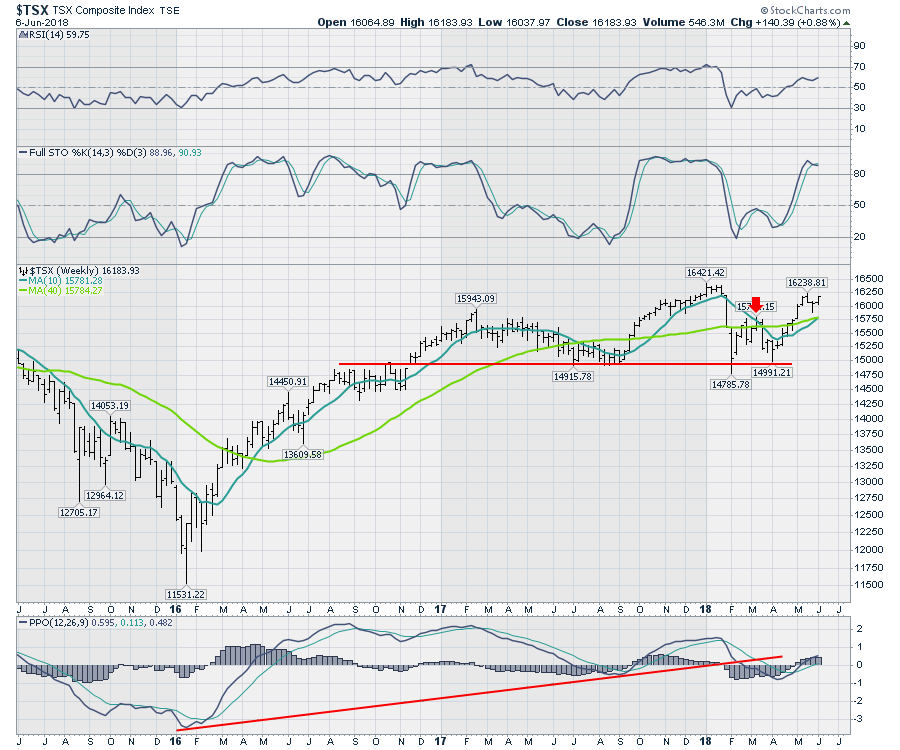
Zooming in on a weekly chart, the Canadian market has traded inside a 500 point range for a month.
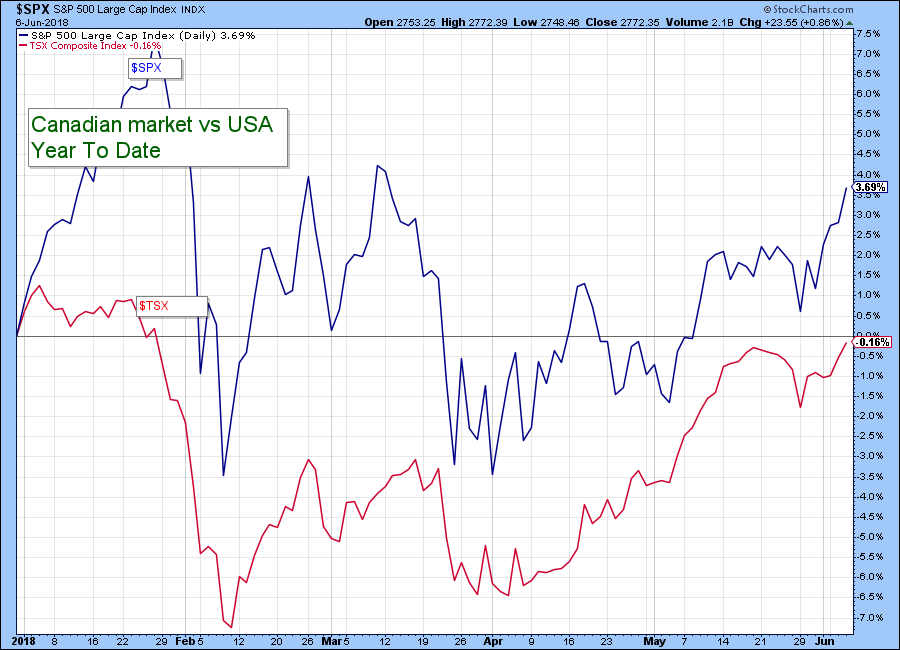
 Getting to a daily chart, we are almost back at unchanged for the year. In the last two weeks the USA went from near unchanged to up 3%. It will be important to watch the US market as it approaches the February and March highs.
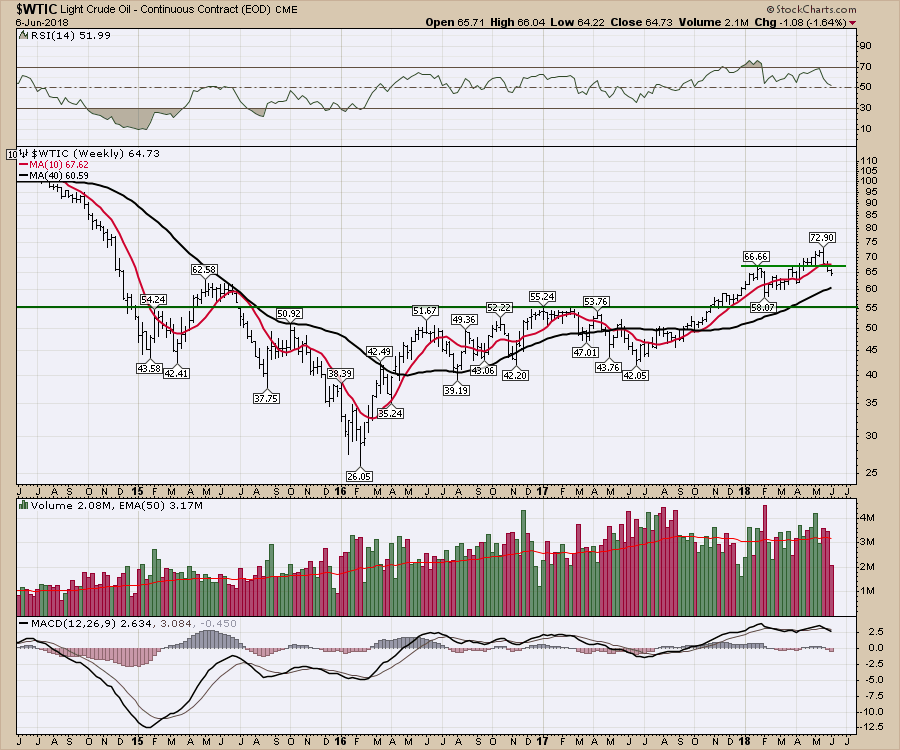
 I mentioned on the video that crude is struggling to find support. It is near two month lows. There is major support now at $55. Perhaps we'll get a retracement to that level and move up from there? With Negative divergence on the weekly RSI and the MACD, this chart looks broken for now. I like to look towards oil companies around the first week of July. That might just fit nicely, but for now it is below the 10 week moving average and we need to wait for some basing.
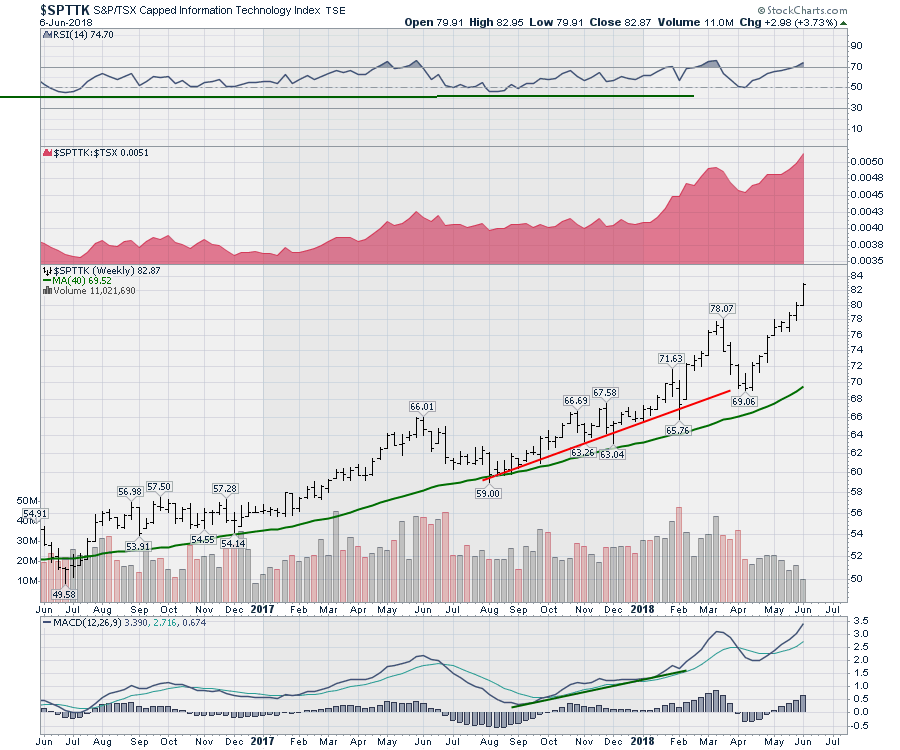
 The Canadian Technology sector continues to be the start performer for the market.
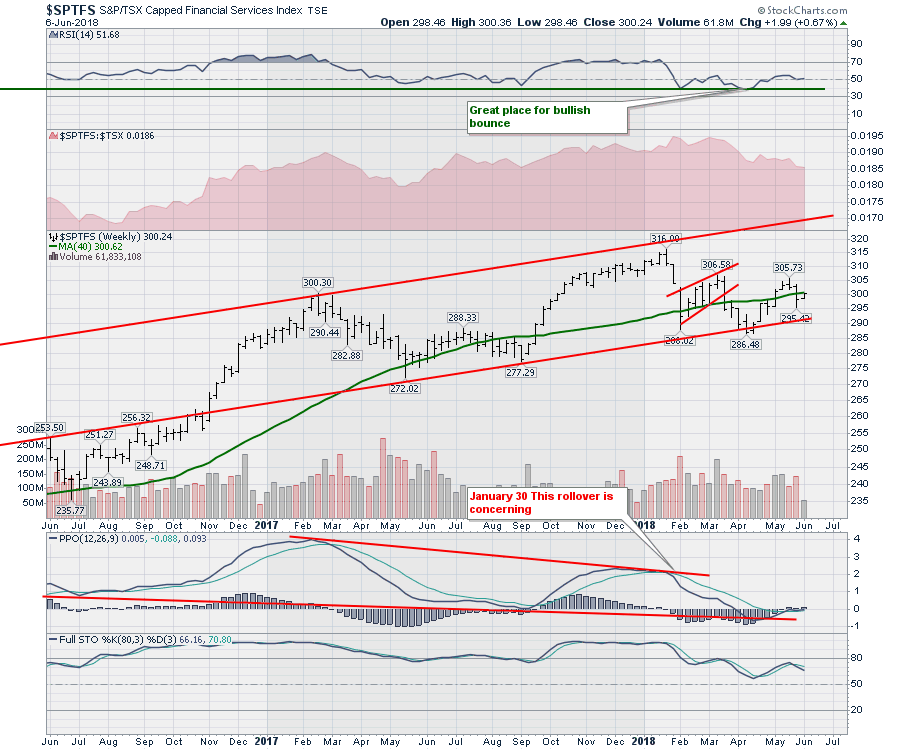
 Financials continue to drift sideways since October. We can also see the 300 level was important in early 2017. So if the financials can start running here, the MACD has just gone positive on the weekly and the 40 week is currently resistance. Getting above the 40 week moving average is also bullish. So far the dead money in financials has been frustrating. If the $TSX is going to break out of its 5 week funk, this chart will probably have to engage right now.
 Here is a link to the video for this week.
I host a new TV show on StockCharts.com called The Final Bar. It airs Thursdays at 5 PM ET and is repeated throughout the week on StockCharts TV. You can also catch it on my Vimeo channel or on the StockCharts.com YouTube Channel.
Good trading,
Greg Schnell, CMT, MFTA
Senior Technical Analyst, StockCharts.com
Book: Stock Charts for Dummies
Twitter: Follow @Schnellinvestor


