With two days left in the quarter, we have some important data points coming out. Friday June 29th will produce an End of Day, End of Week, End of Month, End of Quarter data point. My charts are set up with the tension of a guitar string. Whether it sets off the next Queen - Another One Bites The Dust or the Queen - Don't Stop Me Now is the question.
So here are ten charts that make me very concerned.
$BPNYA and $NYA200R. The first is the bullish percent index for the broader NYSE Index and the second in black histograms is the percentage of stocks above the 200 DMA. Look at the technical levels of these charts when the trend lines break. In all three previous cases they were weak. Having the dots line up so well again is not comforting for me as a bull.
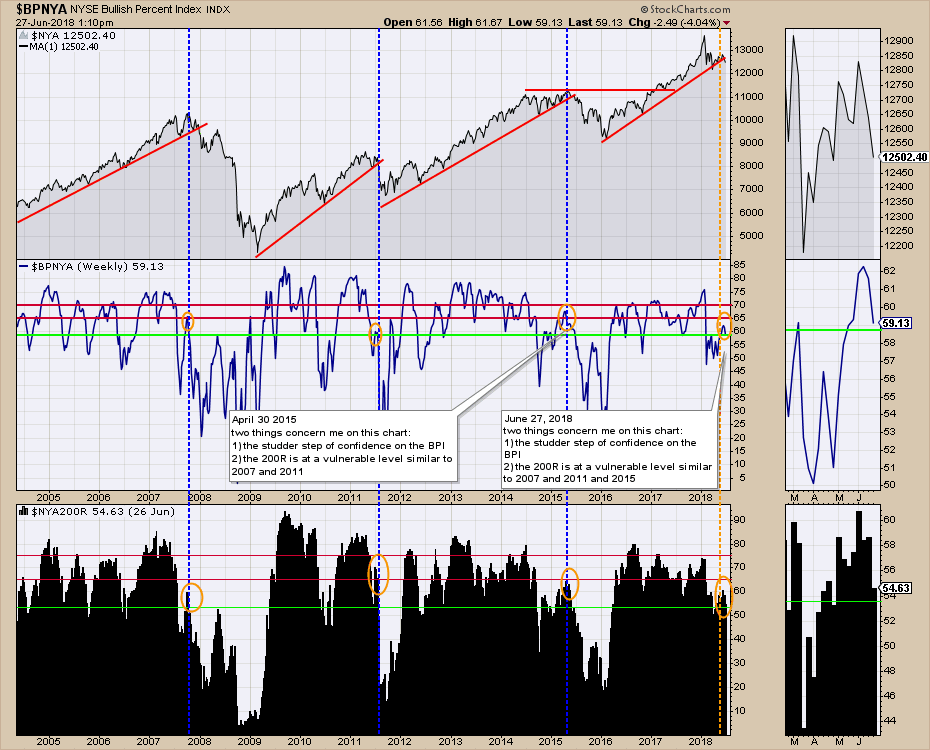 Chart 1 and 2
The regional financials are lagging. The SCTR is falling from top performer status. Check out 2015 when the conditions of lower momentum (PPO falling), the SCTR falling, and the Full stochastic going below zero all happened. The difference between 2017 and now is the very low level of the PPO. PPO's heading south below zero are painful for the long trader. We are breaking the uptrend at the same time.
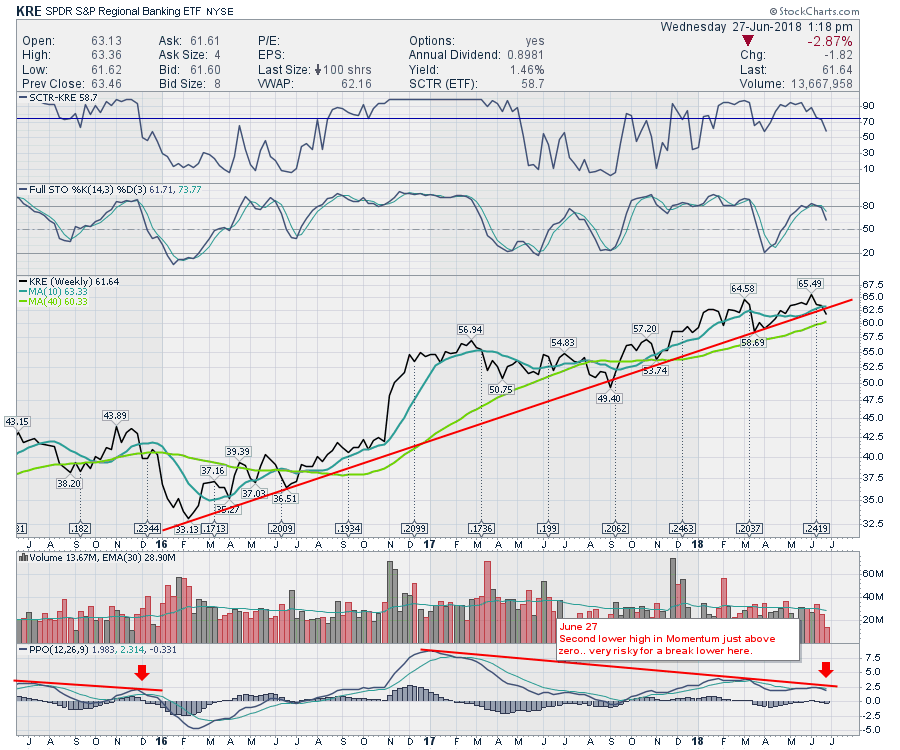 Chart 3
OK. So if the little banks are ruptured, what about the big banks? KBE. The trend line on the PPO is broken which is a huge sell signal for me. It just so happens to coincide with the price breaking the trend line.
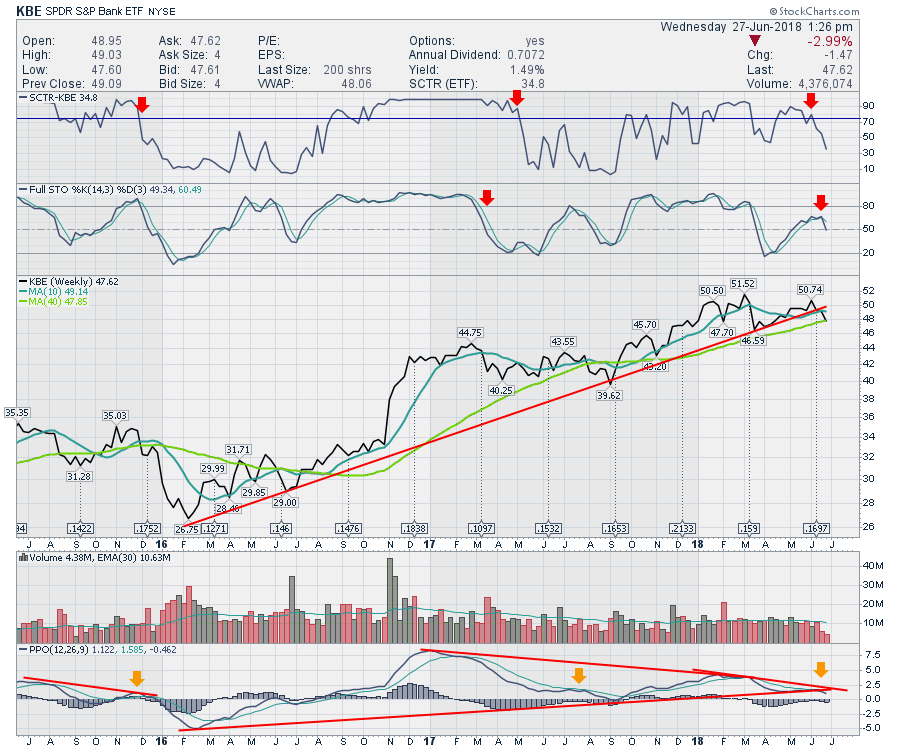 Chart 4
Here is the XLI Industrials Sector ETF. With the ETF having the lowest performance against its peers in 6 years, it is weak. The full stochastics are rolling over around 60 and just starting to drop. The very low PPO failing to make it back above the signal line before diving lower just compounds the clues.
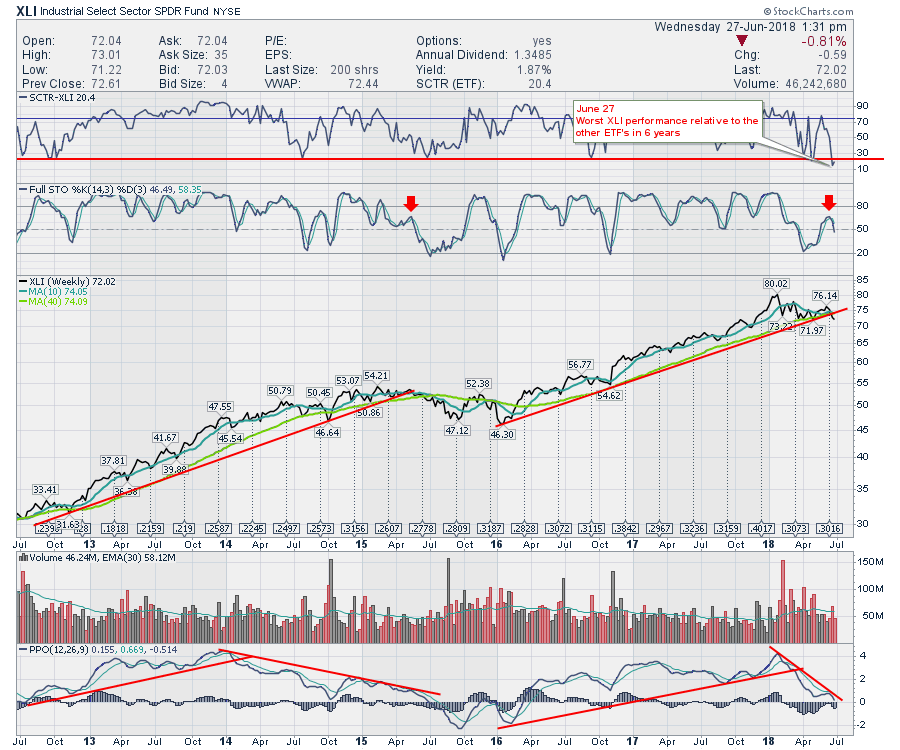 Chart 5
The XLI made highs in early Jan and the KBE put in highs back in February when the SPX topped out. None of this leadership has returned. Meanwhile Utilities have been beaten up and due for a bounce. They seem to be firing up as the market leadership from Financials is falling.
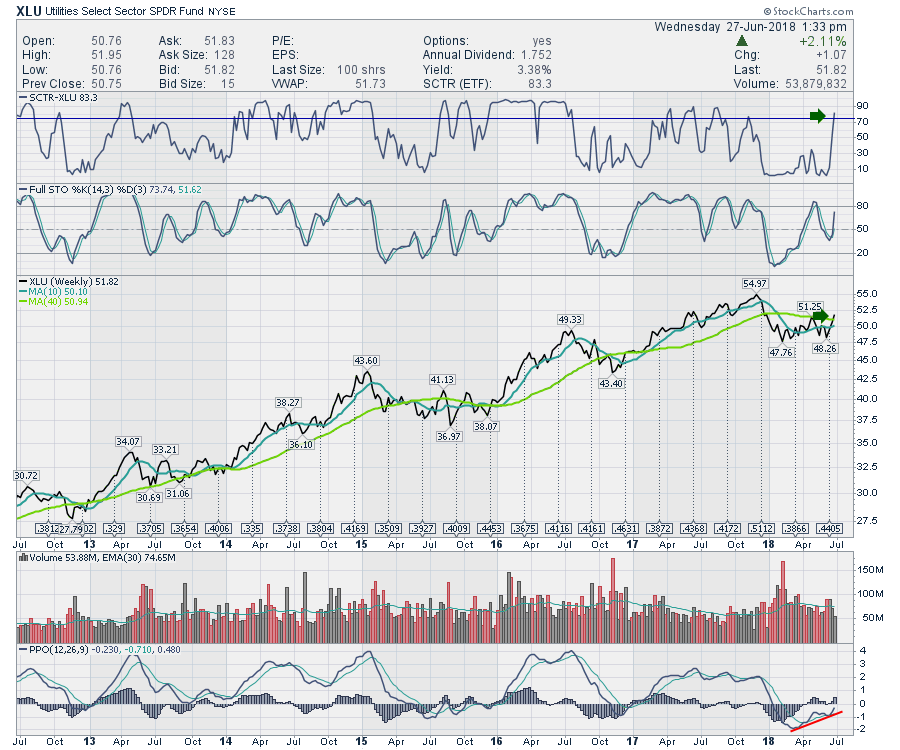 Chart 6
The 30 Year bond yield looks like it is falling, not rising. If the PPO trend line in green breaks, I would suggest the top is in for yields for a while.
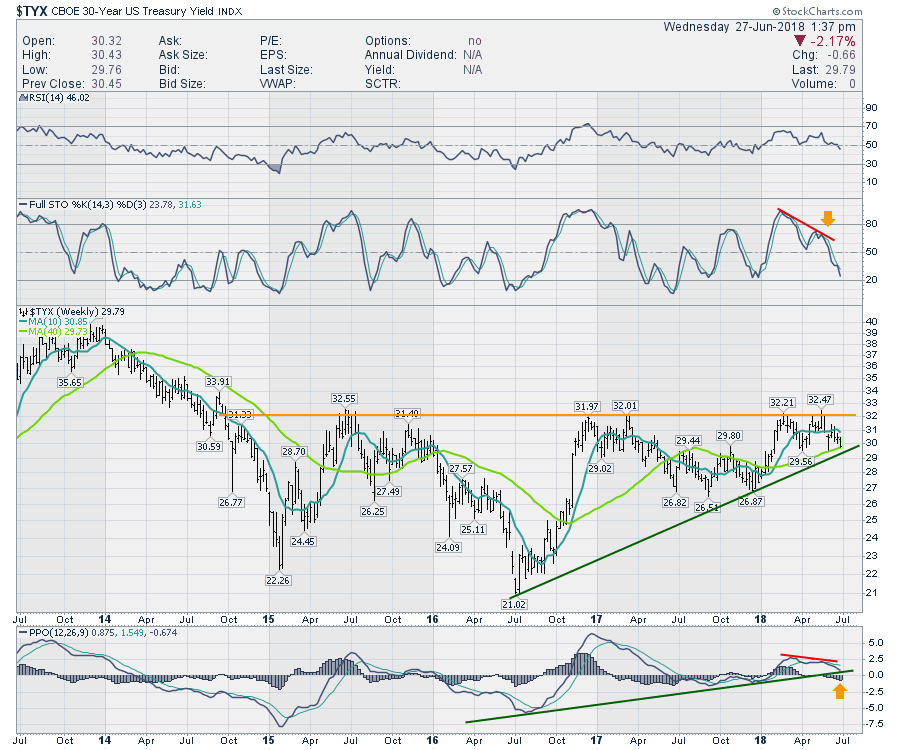 Chart 7
The 10 Year Yield is cracking the up-sloping trend line. The Full Stochastics is going below 50, so that is pretty weak after being up there for 9 months and failing to hold above the 3% yield ($30) on the chart. Notice the petite little head/shoulders topping pattern as it breaks the trend line. If the 2 year uptrend on the PPO below is breaking in concert with the PPO uptrend on the 30-Year Yield above, thats a solid signal.
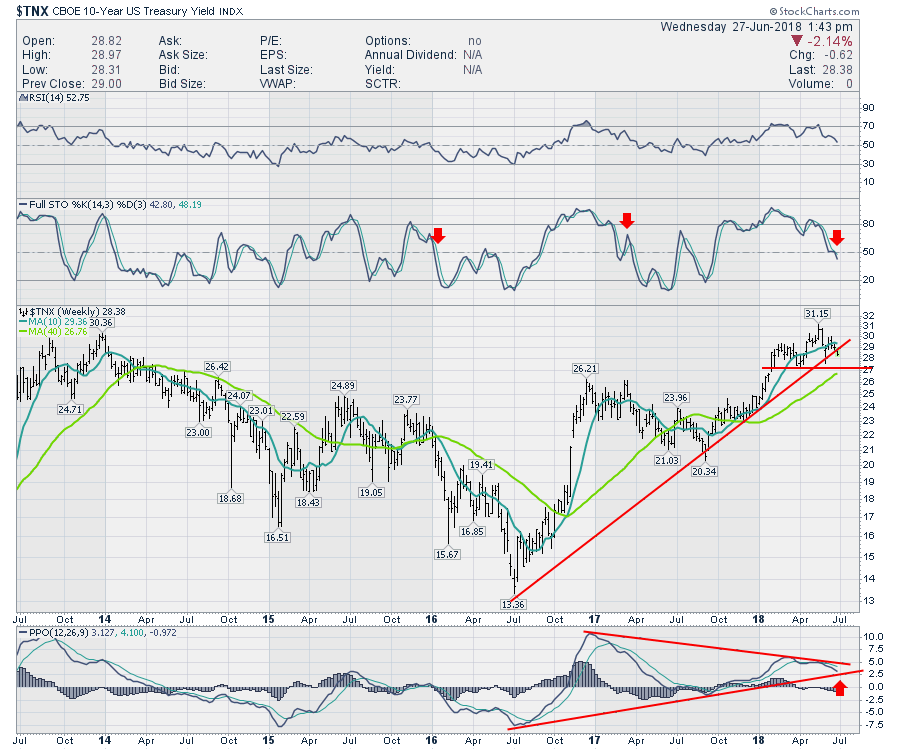 Chart 8
Here is the five year yield on Chart 9. It is also breaking a trend line. I did not draw the negative divergence on the top of the PPO compared to the price making higher highs, but it is a strong clue. Notice the 5-year also failed at the 3% line ($30) on the chart. Bottom line, all these bond charts are breaking down which is not bullish. The bull market in equities occurred while yields were rising.
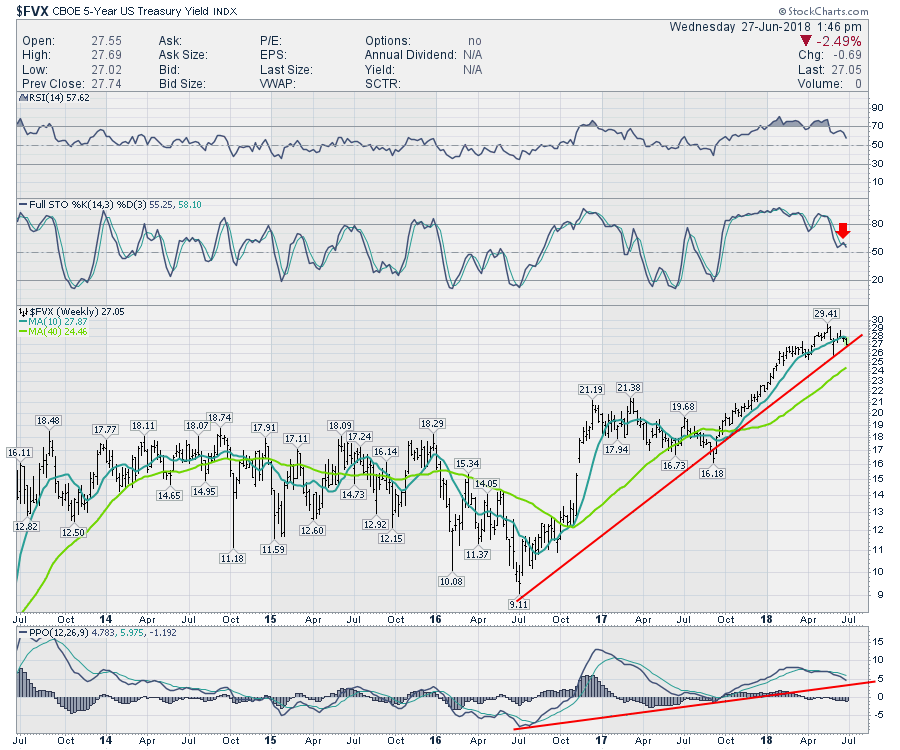 Chart 9
$SPX looks ready to fail right here.
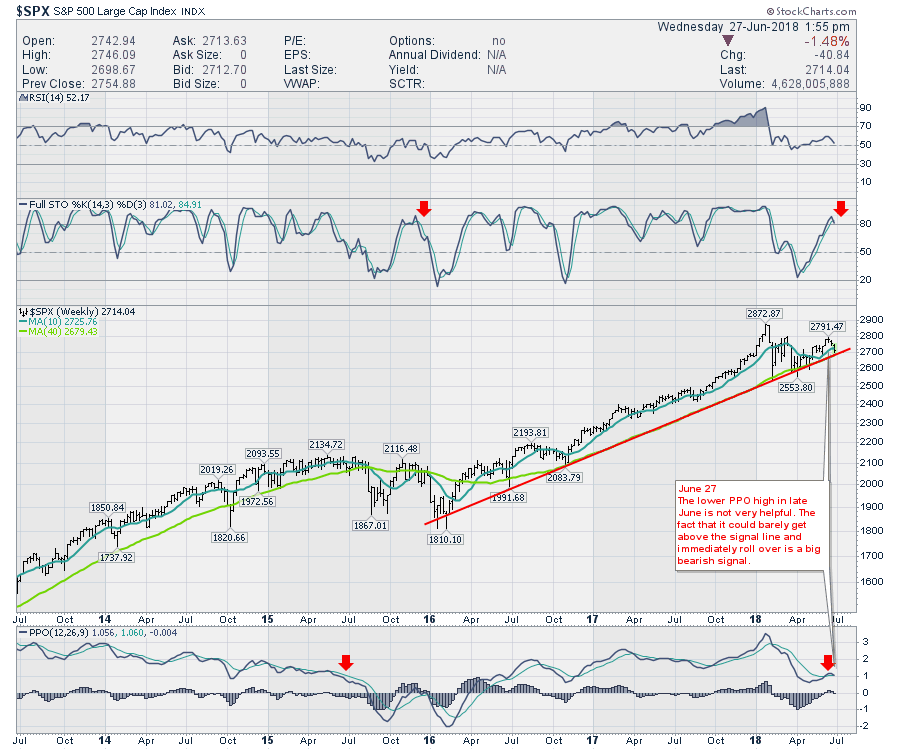 Chart 10
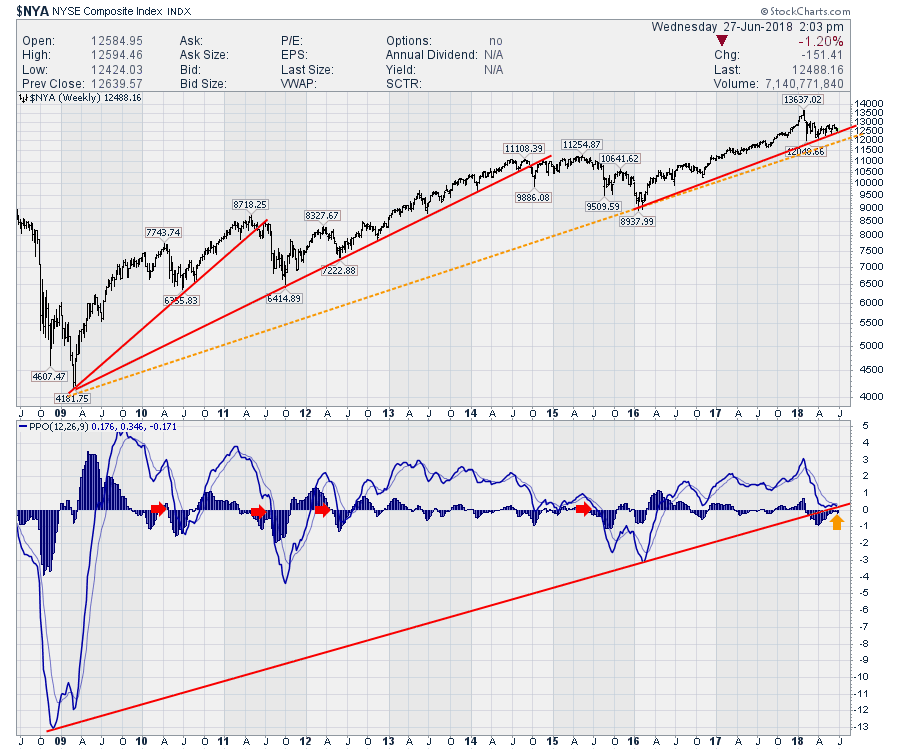
The bonus chart I would refer you too is the $NYA since the 2009 bottom. This appears to have three major legs off the 2009 bottom. While in itself that does not have to be the end of the run, a break of the yellow uptrend line would be more concerning.
 Bonus Chart
While everything is sitting on the barbed wire fence referred to in the title, be careful. It may all work out great, but it is definitely set up for things to fail if the market wanted to.
Good trading,
Greg Schnell, CMT, MFTA


