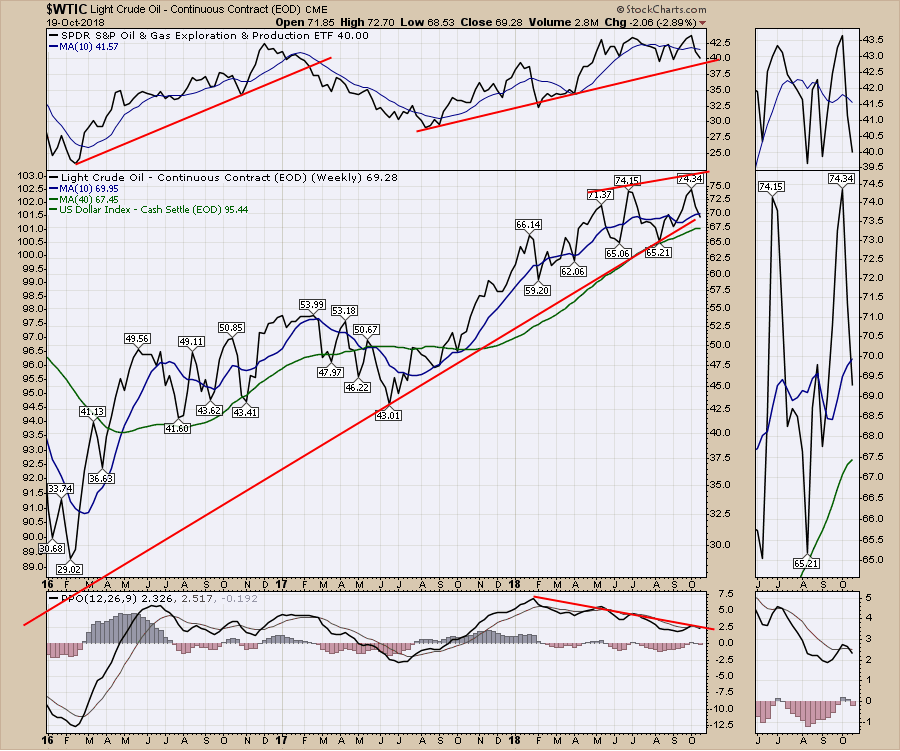
In a rocky week for the markets, the indexes managed to make a higher low so far. In the Commodity space, oil looks weak and some of the corresponding ETF's are starting to break trend lines. In the top panel, the Exploration and production ETF (XOP) has broken back below the 10 week moving average. It has not broken a trend line yet. I stopped the trend line on the oil chart just short so you could see the close clearly. Those lines are intersecting at Friday's close. Oil has also moved below the 10 week moving average.
The declining momentum on the PPO is concerning. However, a break above the downward trend would suggest a new start to momentum. So what does it all mean? Oil looks weak until we see some significant upward thrust. The real problem is there are a few charts corroborating the low momentum.
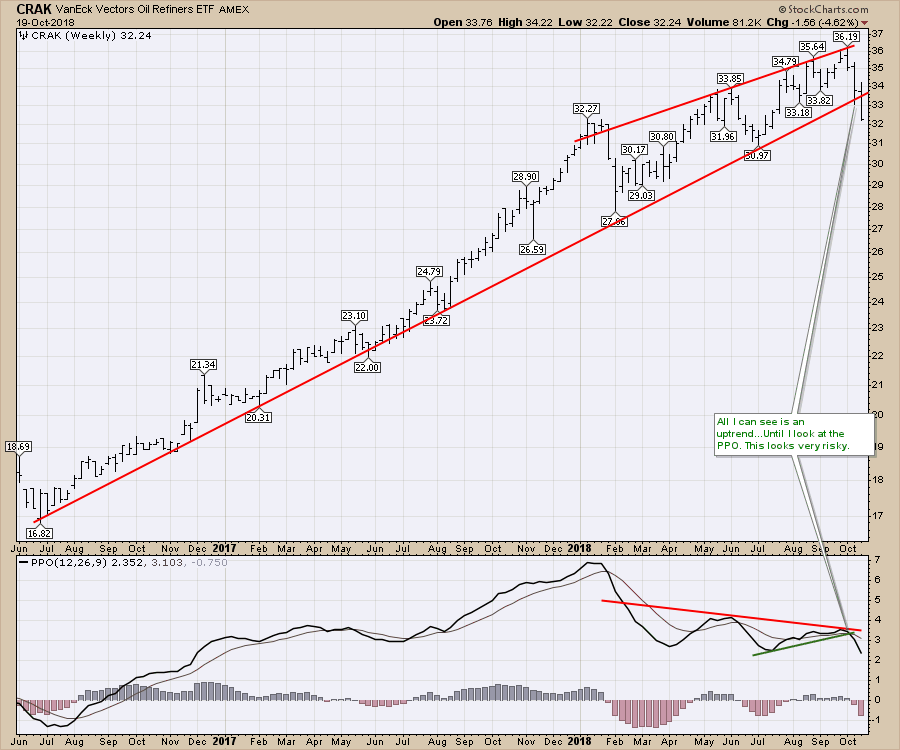
One example is the chart of the oil refiners ETF, CRAK. These are very large companies in the oil business and the ETF chart is cracking the 30-month uptrend line.
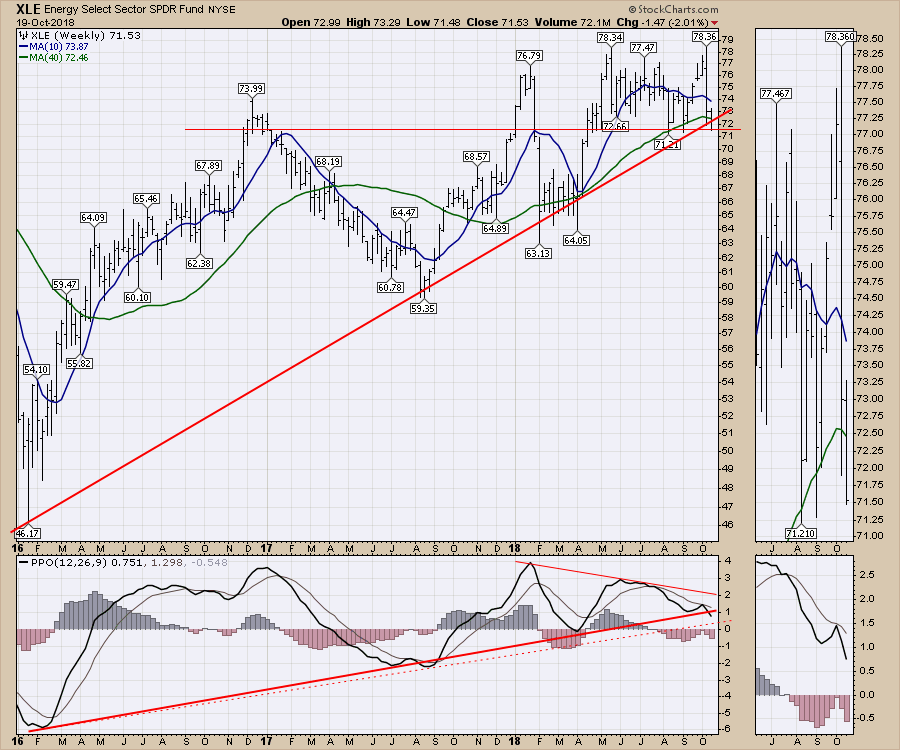
 Another chart related to oil is the XLE which is breaking the down trend line using weekly closes not intra-week lows. The zoom panel shows the closing price at the bottom of the bar. The horizontal support and resistance level is also being tested with the close this week. The three year momentum line on the PPO is also being broken. In my work that is significant.
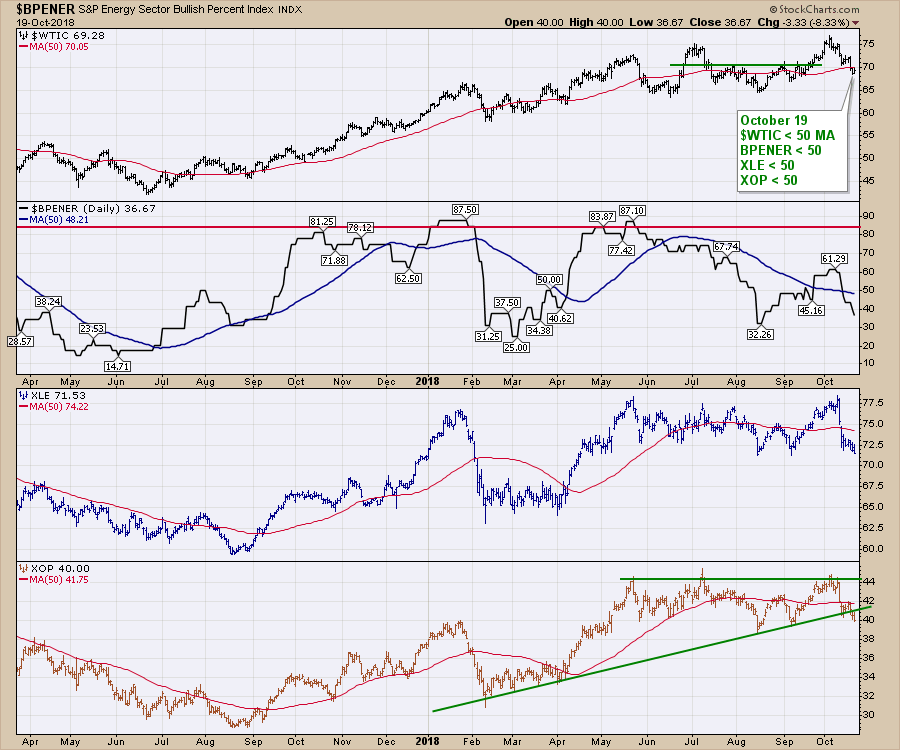
If we compile some of these charts together, we can see they are all below the 50 day moving average. In commodity related stocks, that is usually a good place to avoid. The $BPENER is below 50%. What the $BPENER is telling us is that less than 50% of the stocks in the energy sector are on a buy signal. This means weakness for the sector overall.
Any way I look at it, the current setup for oil and related trades looks problematic. Careful until something changes.
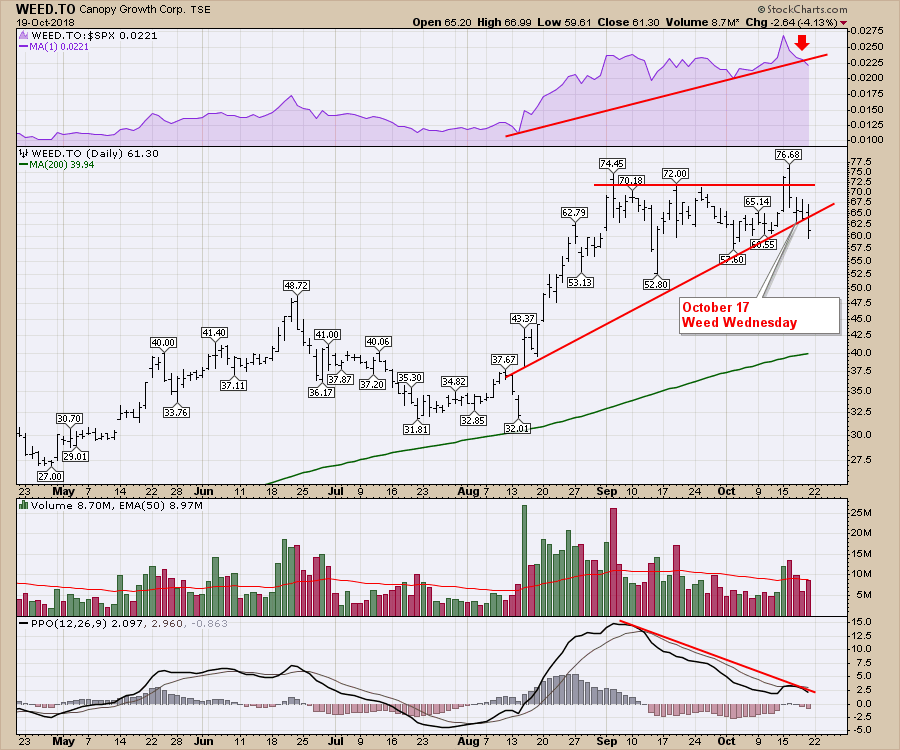
Marijuana was legalized in Canada this week. This is a fascinating study in bubble market behavior. It is always important to figure out if the actual legalization date starts the momentum to take the group of stocks the next leg higher.
I thought the parabolic surge would top the first week of September. I must admit, I expected more weakness than the volatile sideways trading range.
As a technician, watching a stock with very little revenue or profit double in a few weeks on the hype of profits years away seems bubble like. I'll cover off Marijuana stocks in depth on this week's edition of the Canadian market webinar. Be very careful in the space.
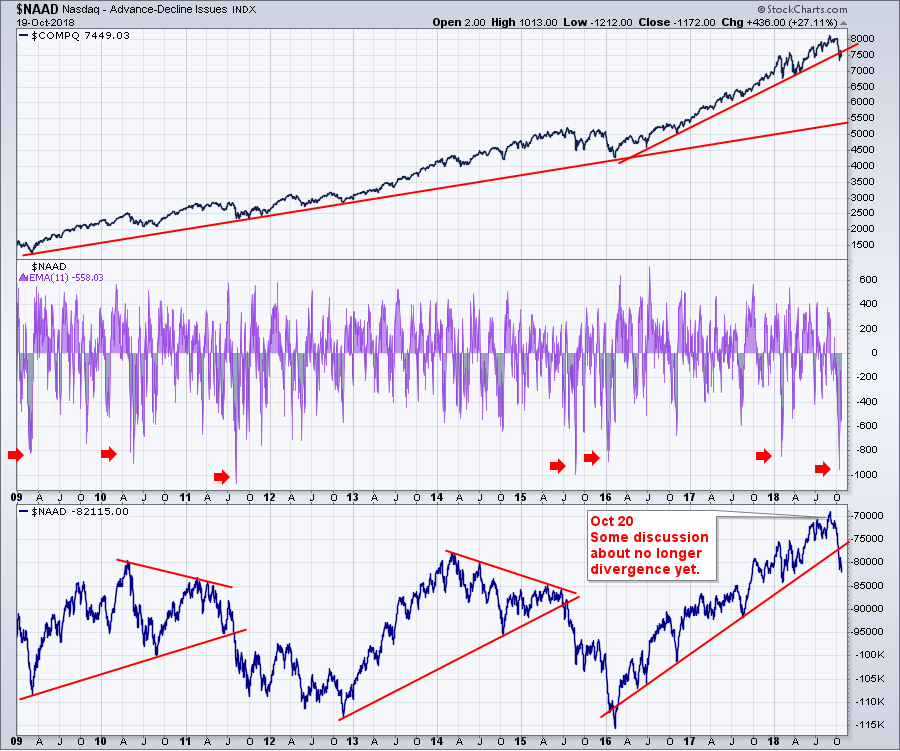
For breadth, a lot of indicators are close to annual lows. The advance decline for the NASDAQ is shown below. In the middle panel is an 11 period EMA. In the bottom panel is the cumulative advance decline line. On the cumulative line, we don't have divergence so there are a lot of technicians saying the final high can't be in yet. I would not be one who suggests we can't top without divergence. There are a lot of conditions in the world weighing down the market.
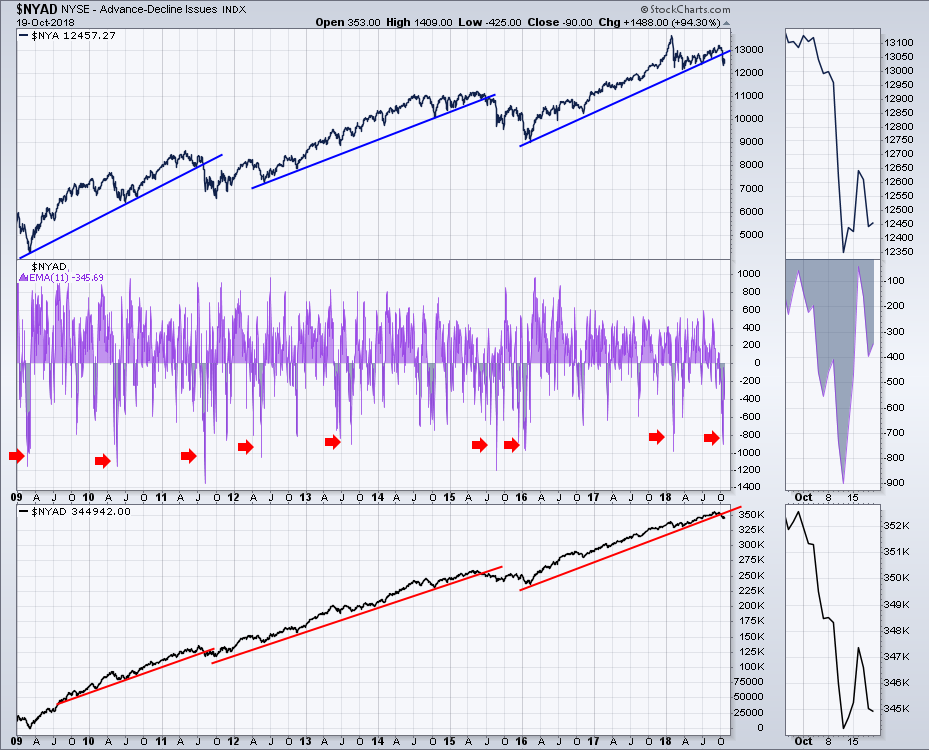
 The New York Stock Exchange Advance Decline line is shown below. It has not created a major divergence on the prior two highs like the Nasdaq did. However, both these charts are at a level to expect a bounce from.
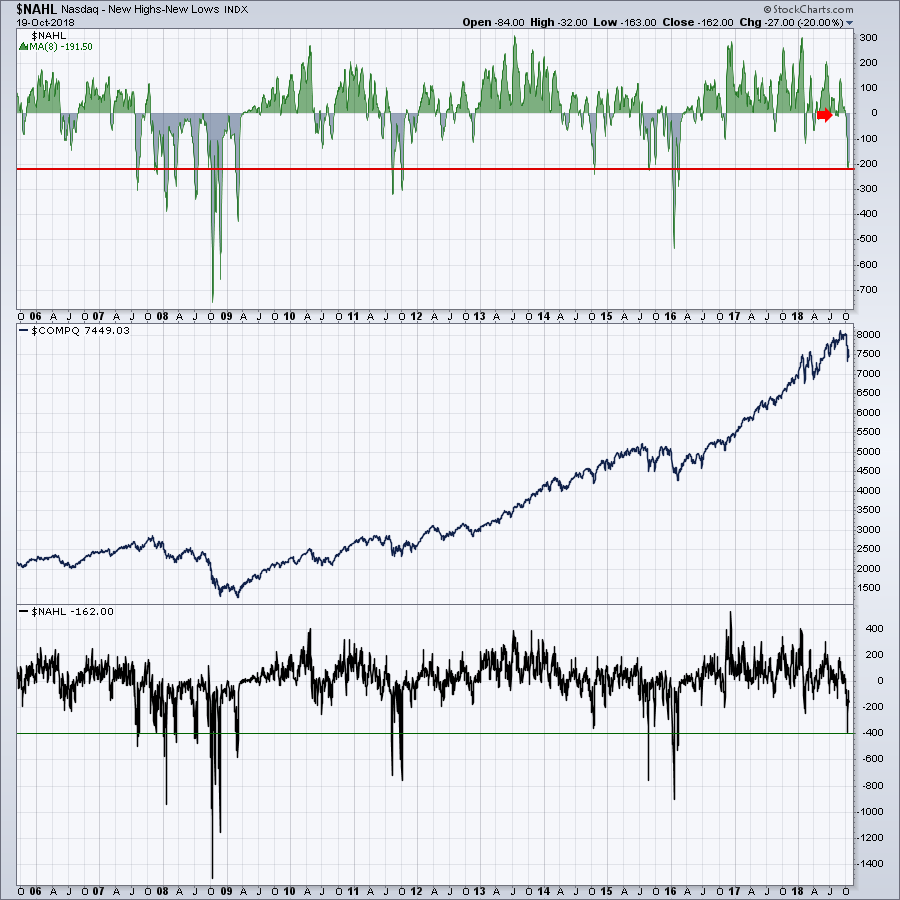
 Here are the High Low Charts. This NASDAQ chart could get a little lower. I think it is important to notice the clusters. Once the market starts to break down this low, we get more selling in the quarter. The exception could be the oil drop low of 2014. However, notice the lack of new highs in green between the 2014 drop and the final market top in 2015. It definitely muted the breadth of the market. On the bottom panel, the individual day lows are shown.
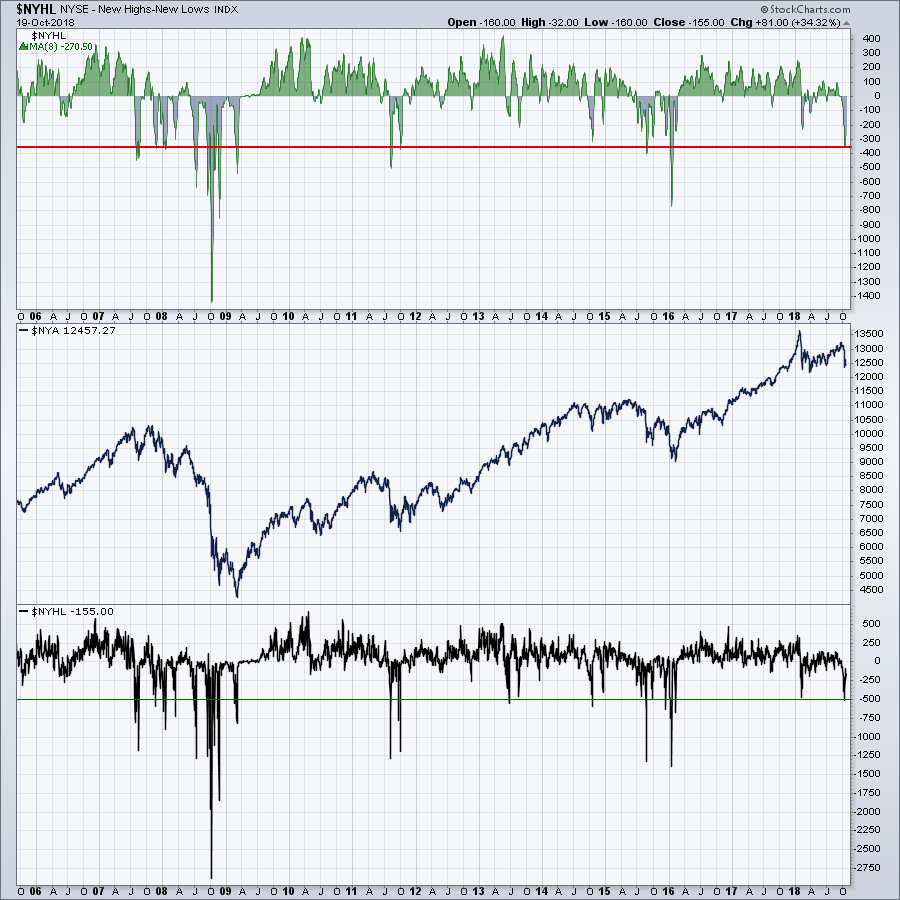
 For the New York Composite, a similar look. All of these charts have pulled down significantly.
 The bottom line for me is to be looking for strong stocks that held up well in this pullback. Simple scans for stocks with a price up at least 10% from two weeks ago generated over 250 stocks.
[type is stock] and [sma(20,volume) > 400000]
and [Close > 2 weeks ago close*1.10]
Another would be to scan for stocks that hit new three month highs in the past week.
[type is stock] and [sma(20,volume) > 400000]
and [this weeks high > last weeks max(15,high)]
Gold is perking up and the stocks are trying to rally. Barrick gold looks good as the biggest company and it is rallying nicely. Natural Gas has been behaving well but the exploration stocks around Natural Gas are still struggling with the overall market sentiment. Lots of information in here on the commodities and indexes. No new breakouts in currencies. The weekly $CRB chart is at a critical point here. Lithium and rare earth metals, steel and coal, copper and aluminum, gold and silver are all covered here.
This is a short look at the broad market setup and some of the indicators that told us the market was fragile ahead of the drop. Probably worth saving a link for use in future years when the market conditions go weak.
The Canadian Technician video shows the massive breakdown on almost every sector chart in Canada. Financials also fell outside their channel and below the 40 WMA. For Canadian investors, huge caution here. There will be a new video out later this week.
If you are missing intermarket signals in the market, follow me on Twitter and check out my Vimeo Channel often. Bookmark it for easy access!
Good trading,
Greg Schnell, CMT, MFTA
Senior Technical Analyst, StockCharts.com
Author, Stock Charts for Dummies
Want to read more from Greg? Be sure to follow his StockCharts blog:
The Canadian Technician

