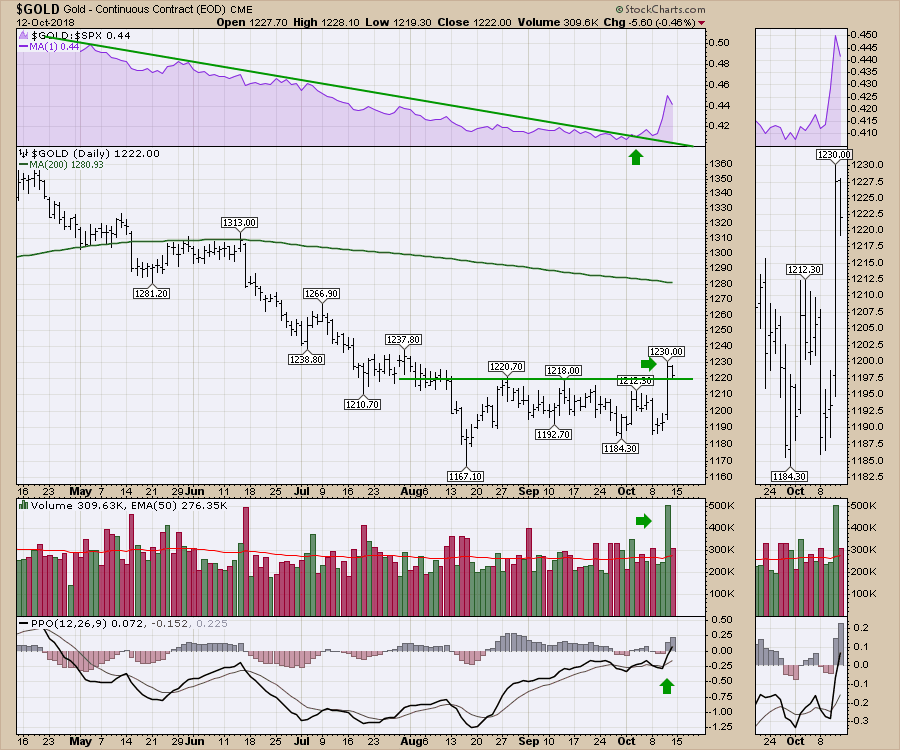
Well, a bruising week in equities bruised commodity related stocks but the commodities themselves held up fairly well. ETF's which hold stocks like SLX, KOL, NLR, URA, XLE, XOP, FCG all pulled back. Precious Metals did better. Gold actually broke through a small 2 month resistance line to close higher on the week. GDX closed up near the highs of the week.
Let's start with some positives. $GOLD looks a little better.
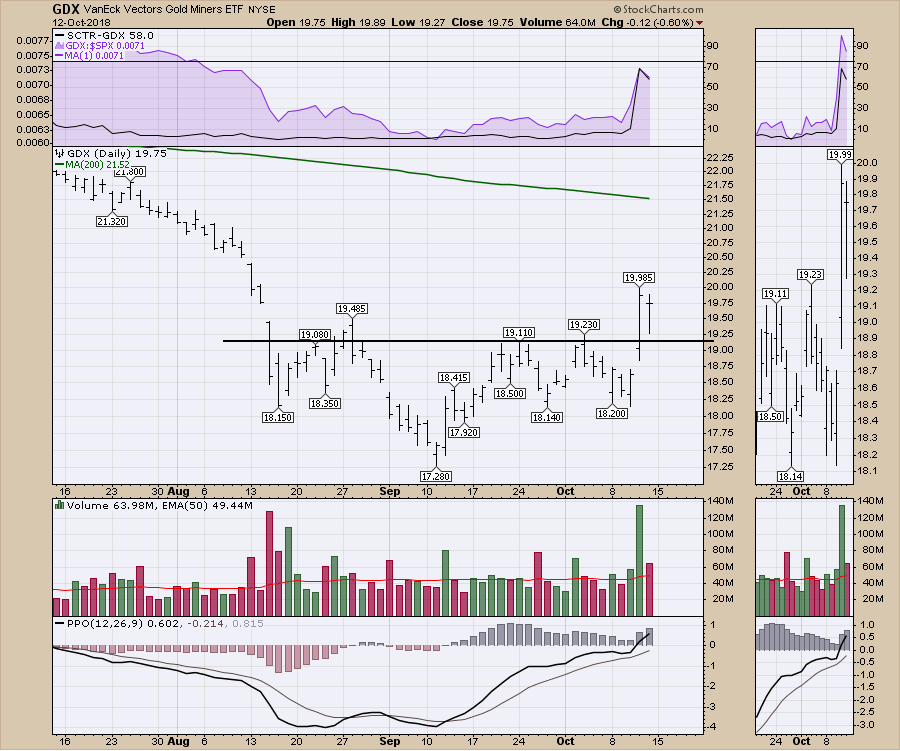
 GDX tested lower on Friday before closing up near Thursday's high. Notice on both the $GOLD and GDX that the PPO moved above zero. This suggests some improving momentum.
 XLE - the energy sector is chopping around. While a lot of charts broke through support, the XLE is still holding within this sideways chop.
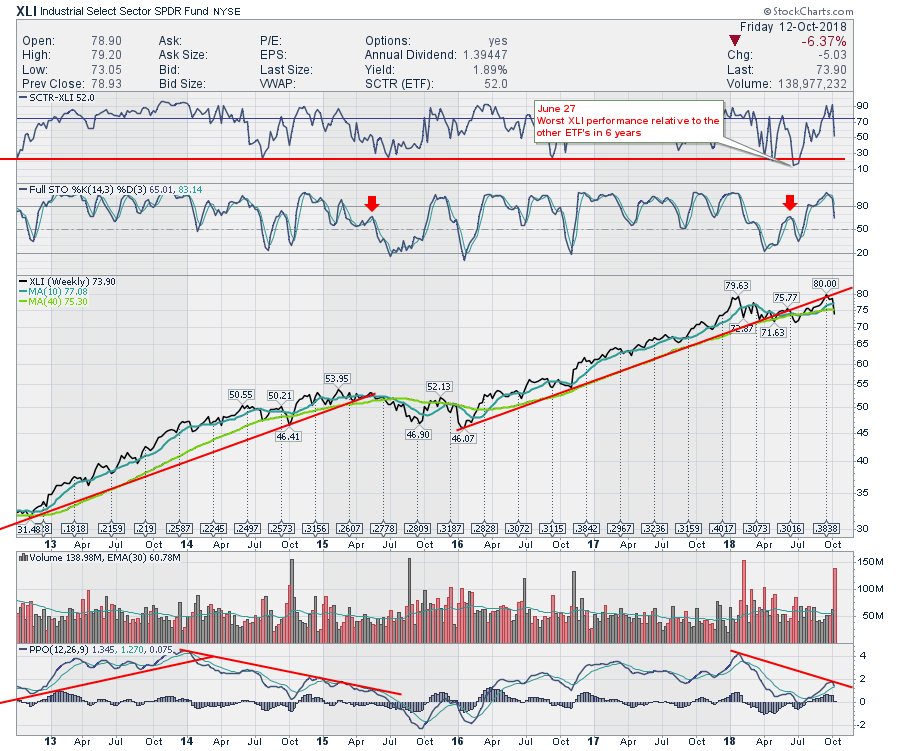
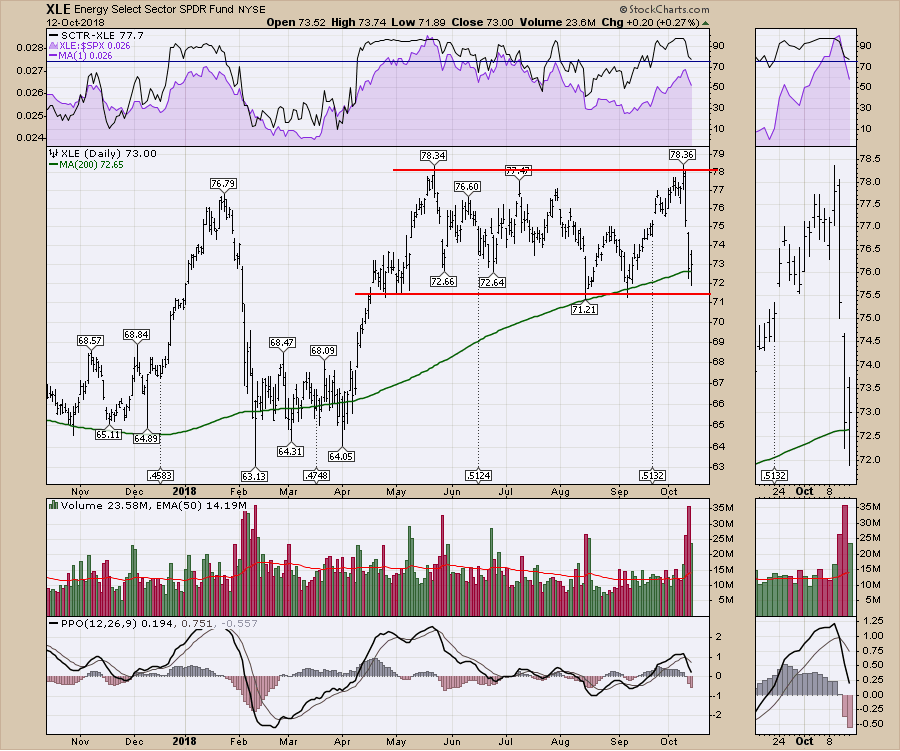 XLI looks like it has formed a double top pattern. A break below $71 would confirm it.
Obviously the weakness we have seen on the indexes has affected the breadth charts. I covered that on the attached video.
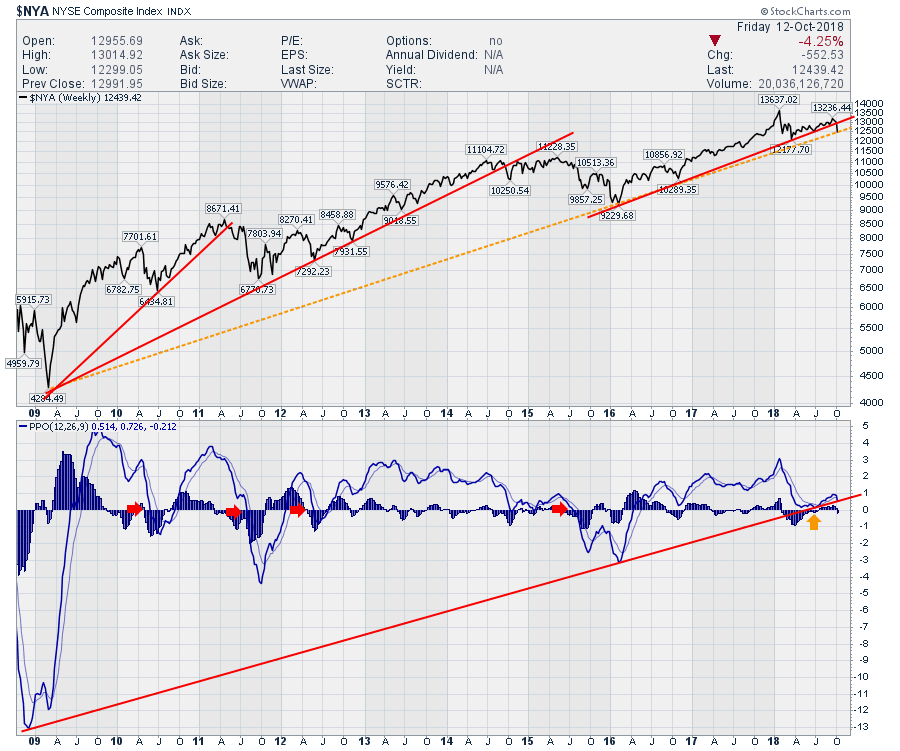
My observation for indexes like the $NYA - NYSE Stock Exchange is that we are in a situation that usually means lower for longer. Here is the chart for the $NYA. While we don't normally associate this index as the leadership index, it does give timely signals when it breaks trend.
The Canadian Technician video shows the massive breakdown on almost every sector chart. This week the Canadian market started what appears to be a major breakdown. Financials also fell outside their channel and below the 40 WMA. For Canadian investors, huge caution here.
If you are missing intermarket signals in the market, follow me on Twitter and check out my Vimeo Channel often. Bookmark it for easy access!
Good trading,
Greg Schnell, CMT, MFTA
Senior Technical Analyst, StockCharts.com
Author, Stock Charts for Dummies
Want to read more from Greg? Be sure to follow his StockCharts blog:
The Canadian Technician

