- Canada has a 300 point rally!
- Canadian banks fall into negative gains on the year
- Gold stocks keep getting better
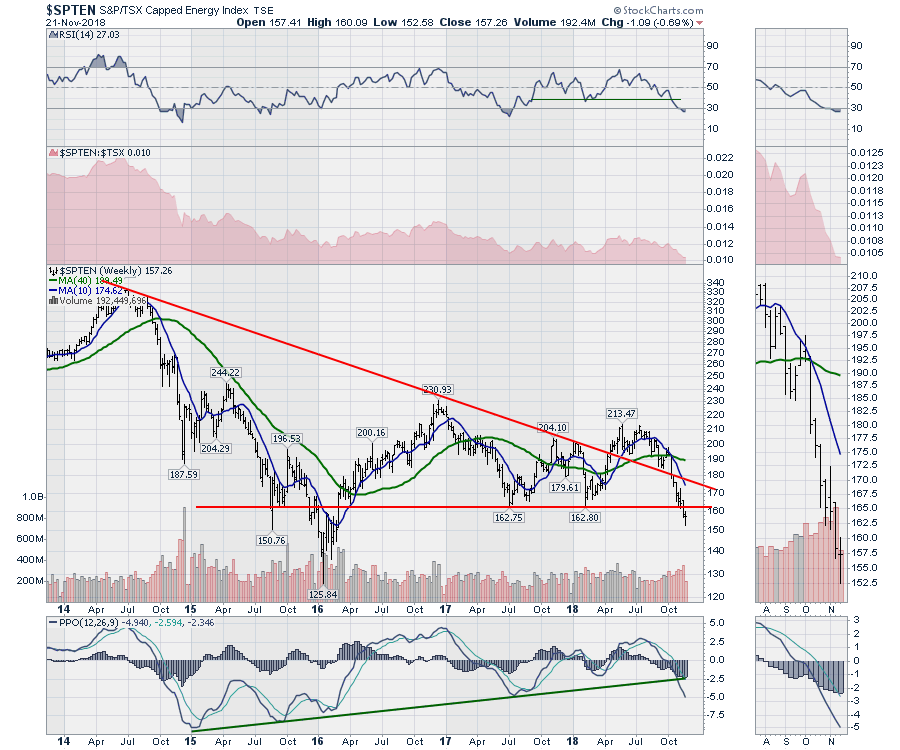
- Energy gets crushed
In the last two weeks, the Canadian market has been oscillating with big daily swings. Wednesday marked the first 300 point rally in a long time. While it did not close way up there, the rally closed Wednesday with a 218 point gain. The ROC indicator shows this as a big thrust off the lows. Notice the last surge of this size also jumped off the lows. The secondary lows also had surges near this size. While we are expecting a bounce after breaking below the spring lows, this appears to be a secondary low from the recent October low.
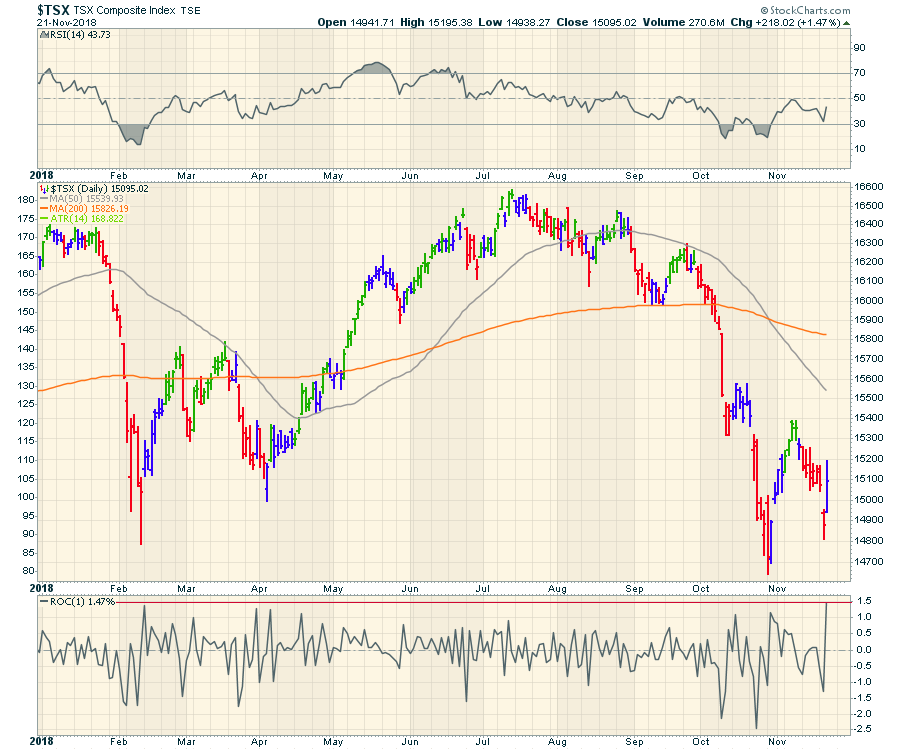 The strong part of this is the Canadian market trying to bounce with a higher low, much like the April low.
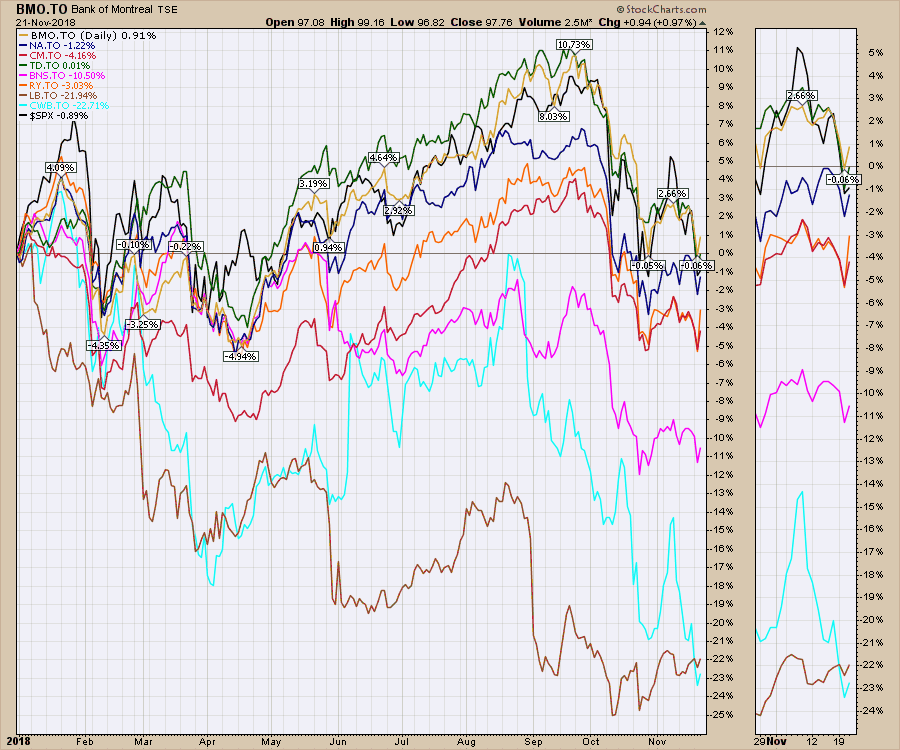
The Canadian banks make up a large percentage of the weighting on the $TSX. All of them had become negative on Tuesday. The Wednesday rally pushed RBC back into positive territory for the year. All of the rest are still negative.
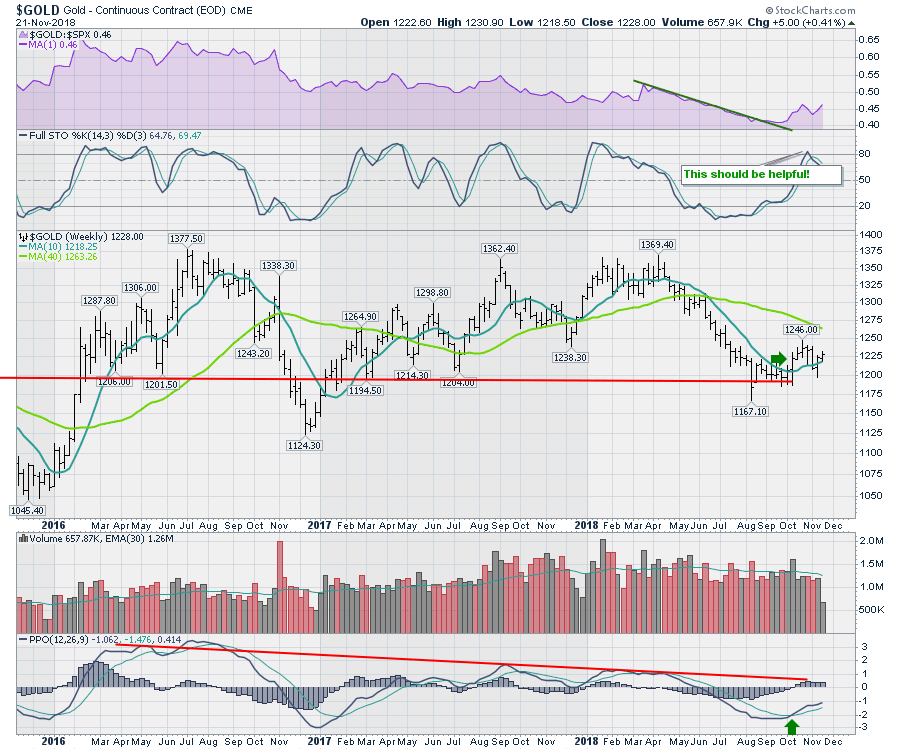
 Gold is finally making small steps to an uptrend. There are higher highs and higher lows. This is starting to look excellent.
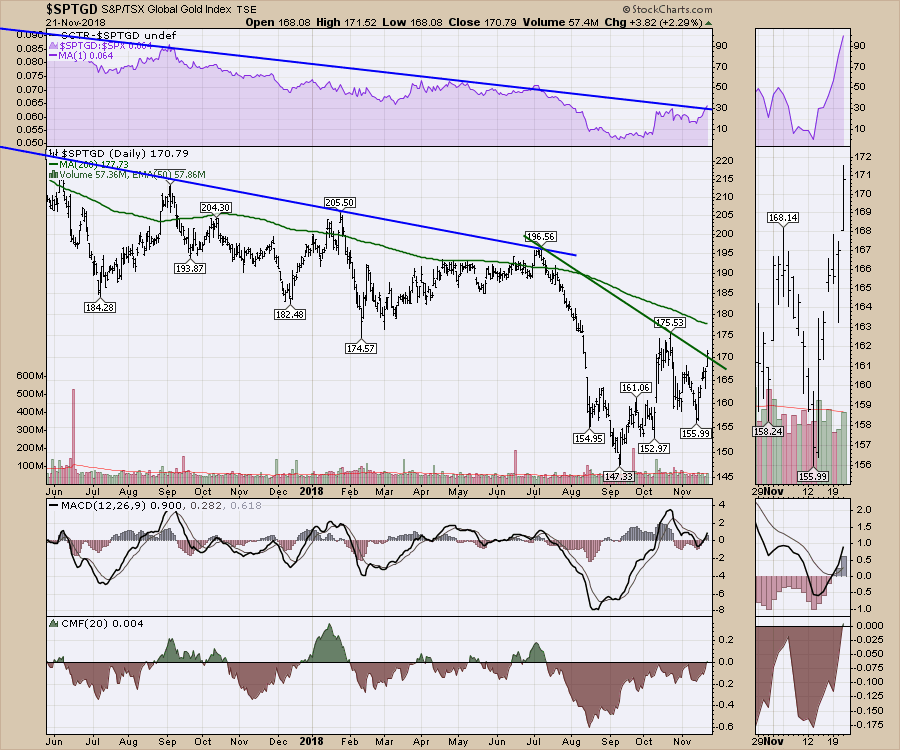
 The Gold miners index is looking really good here. Today was the first day the money flow (CMF) went positive.
 Energy has been collapsing. Wednesday was the first rally in a while. Now that support has been broken, this is an important horizontal resistance line that will need to be conquered to get back into a bullish situation. Notice the 4 year trend line on the PPO momentum indicator. The PPO has clearly broken the uptrend.
 On the video this week, I spent some time to show the strong gold stocks that are trying to break out. I also talked about energy stocks to show how they might base so investors can be set up and prepared for the move.
The Canadian Technician video reviews all the sectors in Canada. The Wednesday rally was a nice kick. Watch closely to see if this can continue.
I think the video is much watch every week, but if you like these setups please watch the video. I caution that extreme moves come both ways when the charts are setup with this much tension.
Here is this week's broad market review video.
This video covers off some of the recent price action including Gold and a return to some of the growth sectors.
If you are looking for a small gift, you might have family or friends that would like to learn more about the basics of charting. The first section of the book walks through all the chart settings to get the charts you want. The second section is why you might use charts for investing and the third section is putting it all together.
Click here to buy your copy today! Stock Charts For Dummies.
If you are missing intermarket signals in the market, follow me on Twitter and check out my Vimeo Channel often. Bookmark it for easy access!
Good trading,
Greg Schnell, CMT, MFTA
Senior Technical Analyst, StockCharts.com
Author, Stock Charts for Dummies
Hey, have you followed me on Twitter? Click the bird in the box below!
Want to read more from Greg? Be sure to follow his StockCharts blog:
The Canadian Technician


