After a bruising day, it can sometimes be easier to turn off the machine and ignore what might be coming. The video included in this document is a brief half-hour discussion about four different things.
When Church Spires Topple
- The breaking down of the indexes
- The advance/decline data also starting to break
- A look at the Nasdaq 100 names
- A look at the transports
My personal indicators are on a full sell signal. After briefly trying to rally coming out of the end of January, they have been unable to get broad participation. Since the rally started in early February, a significant number of groups have failed to make higher highs.
The title of the PowerPoint in the video is "When Church Spires Topple." Week after week, we had charts making spires into the sky - MSFT, TSLA, SPCE, NLOK and S, to name some of the bigger names.
I mentioned in an article two weeks ago that MSFT had gone parabolic. (Microsoft Follows Tesla On The Arc.) The Nasdaq index was 18% above its 200-day Exponential Moving Average, visualized on the chart below using the (1,200) setting on the PPO indicator. It has not been this euphoric in 17 years. Betting on it going even higher with average earnings and COVID-19 seemed a stretch.
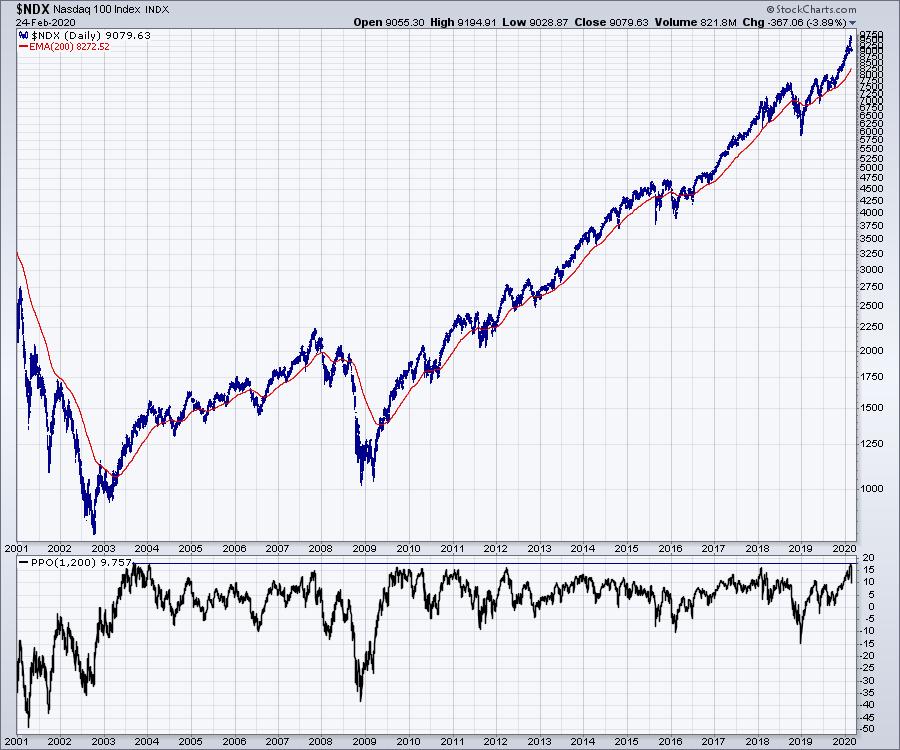
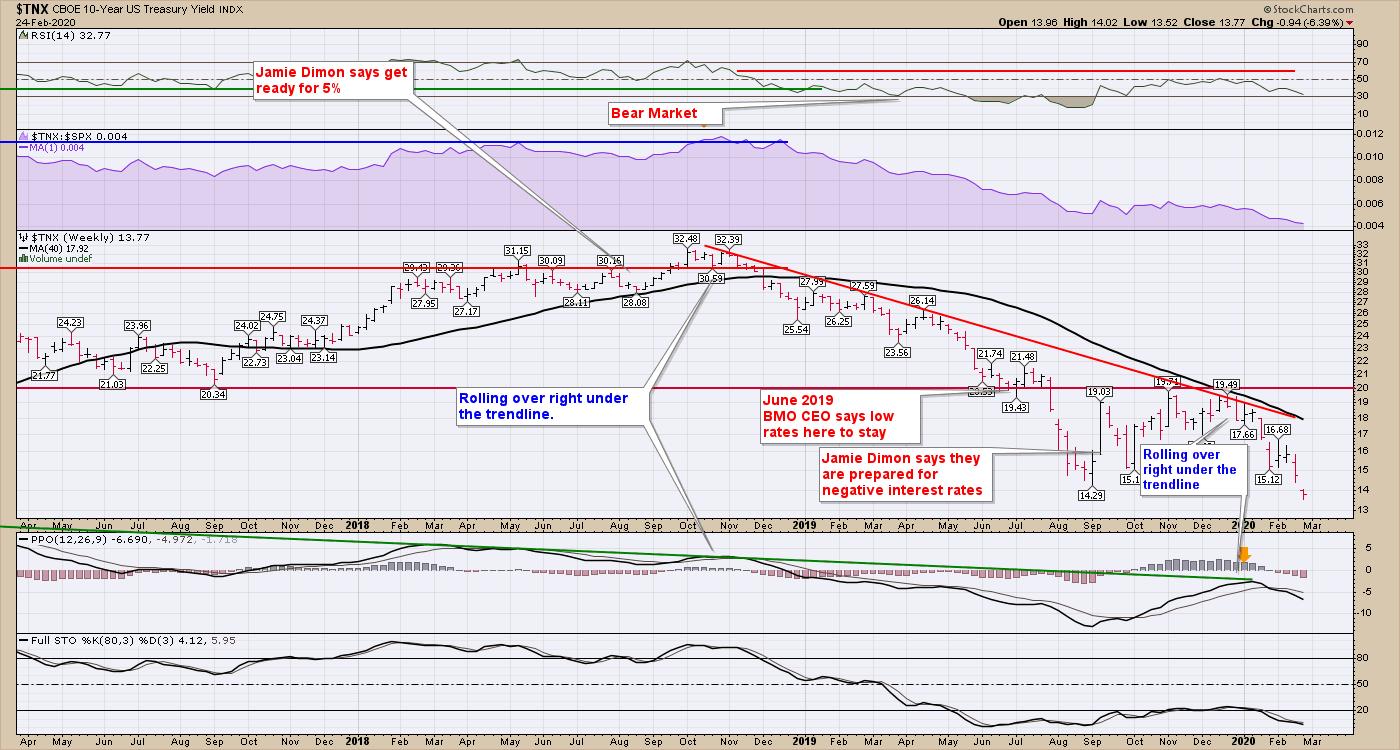
On top of simple pictures like the one above, we have seen a consistent decay in bond yields, commodity prices and foreign markets, suggesting things are changing rapidly.
With the 10-year cracking new lows, that adds to the continued pressure here.
Gold has been acting well, but Gold and Gold miners made big reversing candles on Monday. I thought that might be a hangout, but even that looks stretched.
With the breakdown in the Euro, it looked like we could trade country indexes, but that isn't working with a global slowdown.
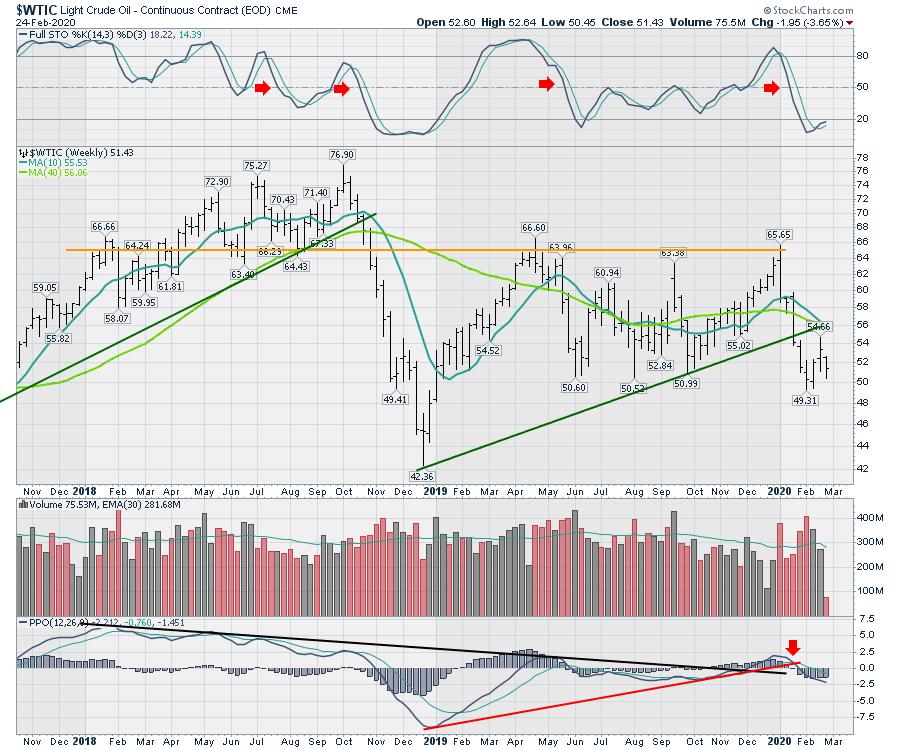
Commodities are getting crushed, so that is also difficult.
As I mentioned in the video, this does not look like a place to aggressively join the market. There are some signs of a major long-term top for countries in Europe, but it is too early to start explaining how that might play out. The most important thing is to not let the market run away with your capital.
I recorded some Market Buzz Videos last week; you can find them here.
Good trading,
Greg Schnell, CMT, MFTA
Senior Technical Analyst, StockCharts.com
Author, Stock Charts For Dummies
Want to stay on top of the market's latest intermarket signals?
– Follow @SchnellInvestor on Twitter
– Connect with Greg on LinkedIn
– Subscribe to The Canadian Technician
– Email at info@gregschnell.com


