Week in and week out, lots of charts change. It is the collective identity of the changing mood in those charts from bullish to bearish that eventually takes its toll. With the market thrusting higher the last couple of weeks, the bulls were unanimously in control. Since June 9th, the momentum was starting to wane a little, but it didn't foretell the pounding that would come after the Fed meeting. How you can hand out trillions and still get a 5% down day should be a research project.
This article highlights some charts that are changing that need watching as we head towards the end of the second quarter.
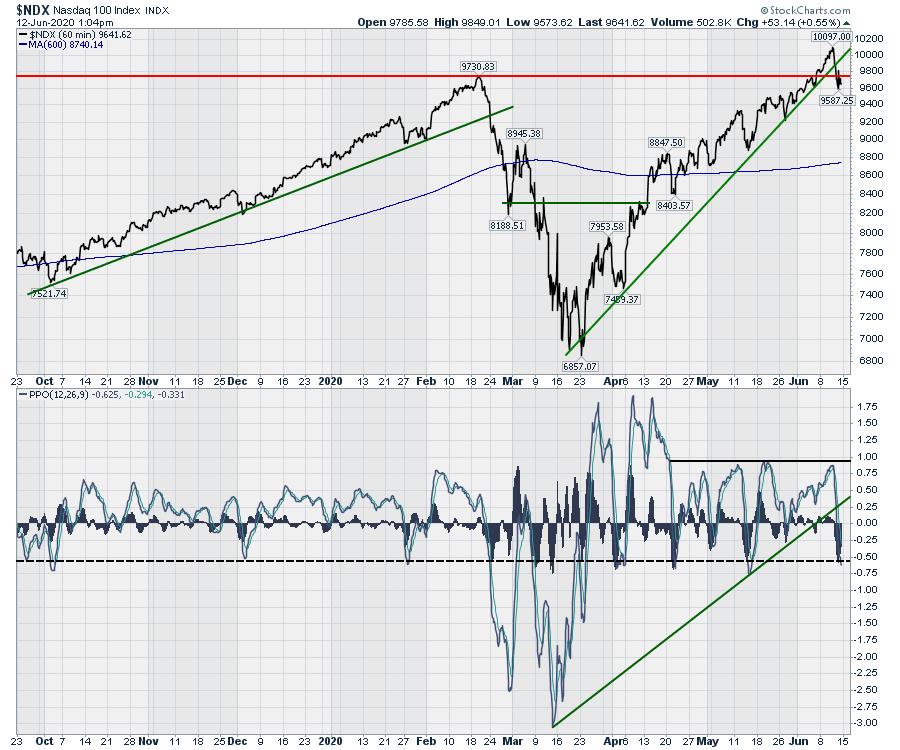
First off: The Nasdaq 100
There are a few positives. The index is trying to hold the breakout above the February highs. The second positive is on the PPO in the lower panel. This is typically a normal pullback and it bounces from this level. The biggest negative is the slope of the uptrend on the price panel has been broken. It could just be moving to a more normalized slope level at the angle of the one in 2019. I have drawn a PPO trend line that coincides with the May 14th low and that is now broken. At this point, this trend line seems less valuable due to the lack of it really following a trend of higher lows on the PPO. The sharpest move down since April 1st, on the back of a Fed meeting does not sound bullish. It definitely makes the start of the July earnings season come into focus as well.
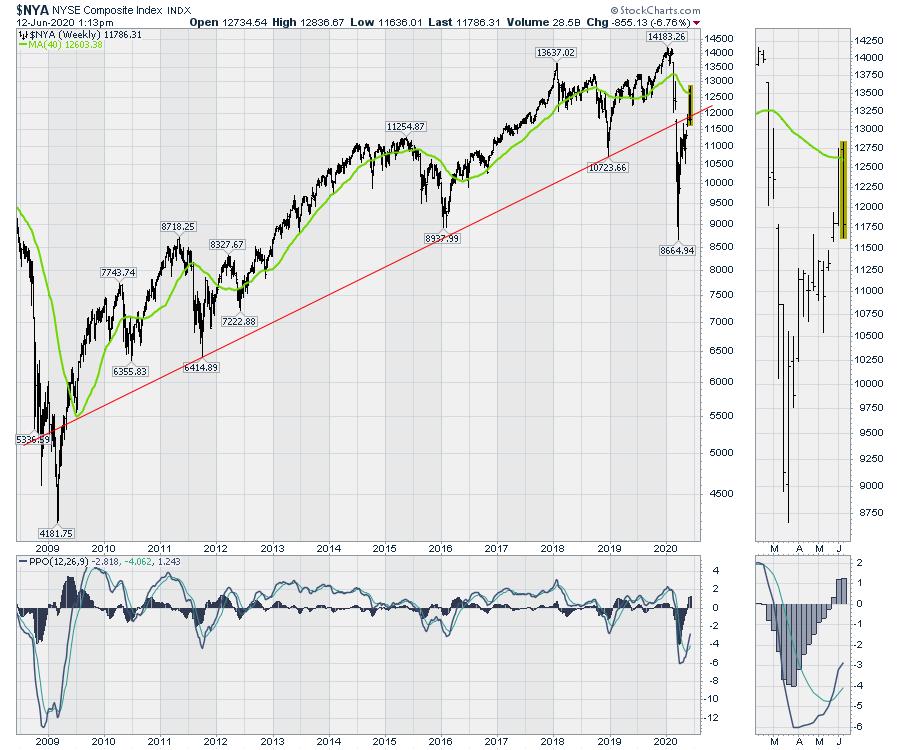
The $NYA - New York Composite -
There is a lot of discomfort for me on this particular chart. One is the failed backtest of the 40-week moving average green line. The second is that 13000 has been a major resistance level for years and we failed at that level again. One of the positives is that the red trend line still sits as support as price tests the level to close the week. If this chart continues to fail there, that would be a big warning to me that the long term trend is changing to down.
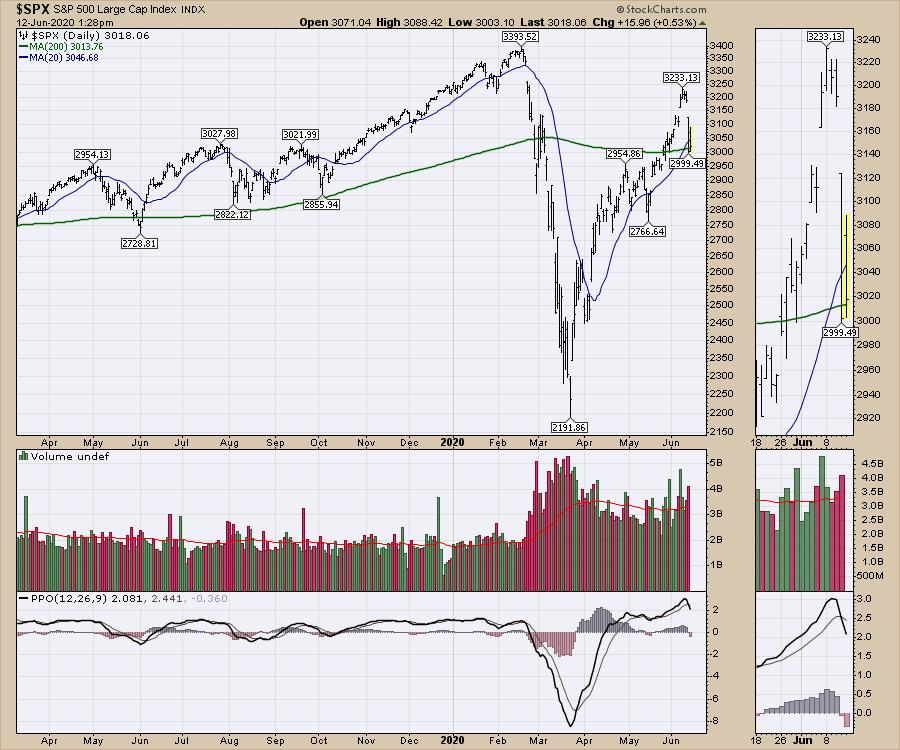
The $SPX is failing to stay above the 50-day moving average a little after midday Friday for the second day in a row. That is concerning. So far the 200-day moving average is holding, but this looks very important for the uptrend. The PPO has a sell signal on it for the second time within the last 20 trading days, so we are definitely losing momentum. In terms of selling days on above average volume, we have had 2 this week and one last week. That also bears watching.
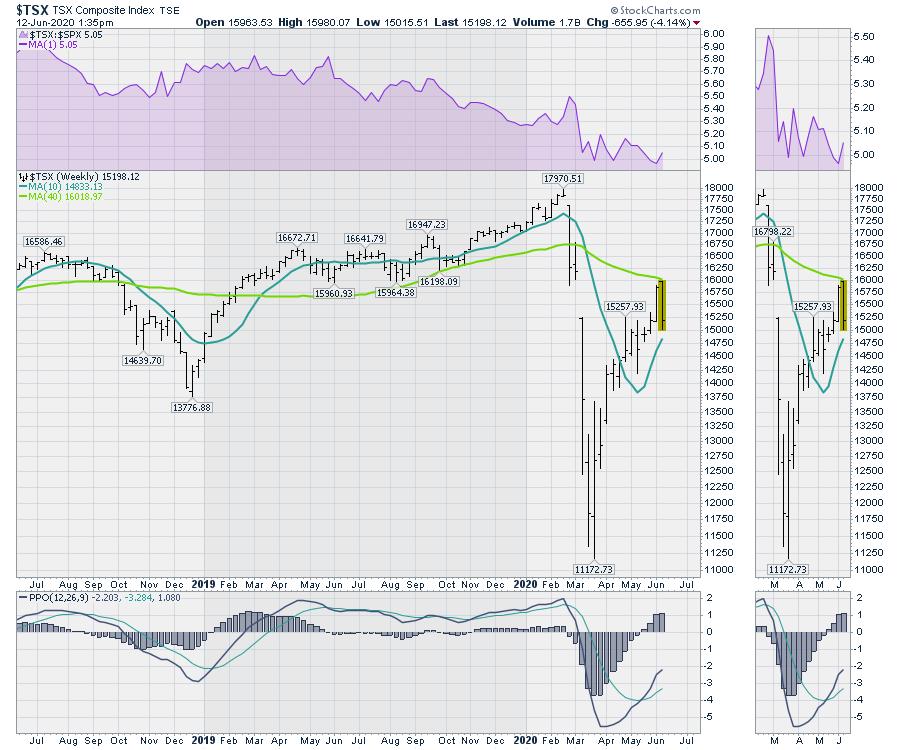
The $TSX
The Toronto stock exchange is sporting a bearish outside reversal right at the down-sloping 40-week moving average. That is how a textbook would define a failed test of the moving average.
The group of charts looks very unstable and will need to see support hold through the end of the month. With the $VIX back above 40, caution is definitely warranted.
I'll be publishing a newsletter on the weekend that helps analyze the course for macro-investors. If you are interested you can try our newsletter for a monthly subscription of $79 at GregSchnell.com.
Good trading,
Greg Schnell, CMT, MFTA
Senior Technical Analyst, StockCharts.com
Author, Stock Charts For Dummies
Want to stay on top of the market's latest intermarket signals?
– Follow @SchnellInvestor on Twitter
– Connect with Greg on LinkedIn
– Subscribe to The Canadian Technician
– Email at info@gregschnell.com


