In the abnormal environment we find the world in now, one of the major changes we are seeing in the charts is in the world of currencies. The familiar phrase "the buck stops here" is taking on a whole new meaning this month. At this point, we need to be on the lookout for at least a bounce in the dollar as it plummets to the COVID spike low. We are testing it heading into the weekend. A break below would mean a 20-month low for the dollar. The COVID spike down in March briefly marked new 1-year lows, but then the sudden reversal popped it back up. Can the dollar get enough momentum to bounce back up this time?
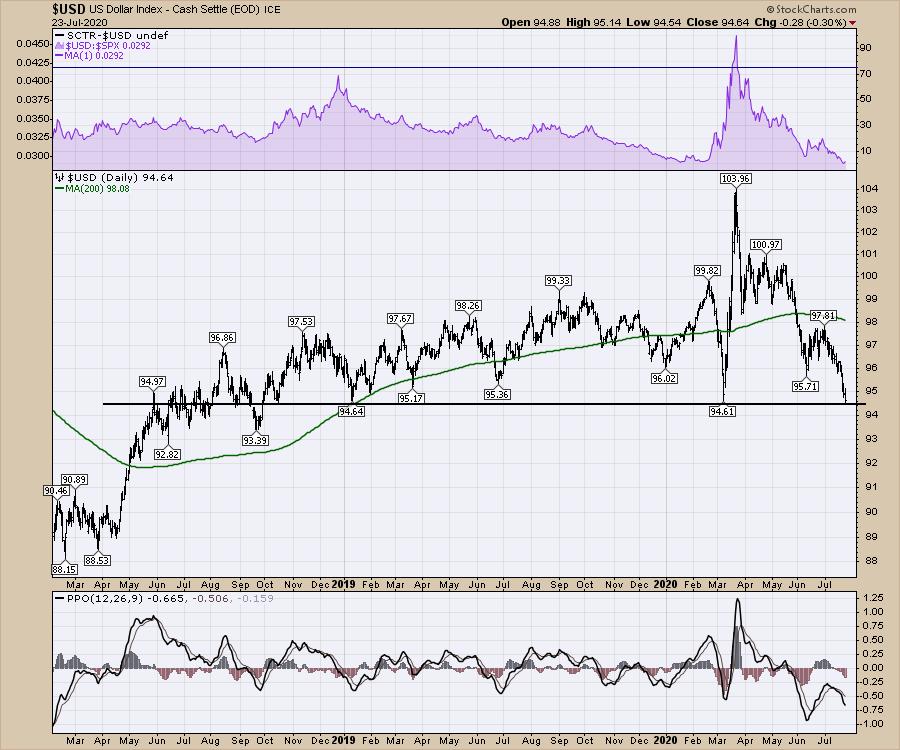
On the bigger picture, the US dollar on the weekly chart is breaking some meaningful trend lines as well, the most important being the 30-month uptrend using the lows on a bar chart. The violation of that trend line this week has sent the dollar down hard.
I would like to point out that the PPO has gone negative as well. The negative PPO on the weekly chart is a compelling reason to be aware that the dollar may be weak for months to come. The two examples on the left where the PPO went negative, marked by the red lines, saw the dollar drop quickly. Recently, the dollar did not plummet as soon as momentum went negative. The dollar bounced for a few weeks, then rolled over. Now it appears to be catching up in a race to the downside.

However, the bigger deal for the dollar is the sudden drop on the monthly charts. We have a few days to hold the trend line, but, just using monthly closes, the US dollar is breaking below the 10-year uptrend. The 23rd is not the end of the month, so we need to wait and see if this is going to hold, but the next week is very important for long term signaling on the dollar.

I actually don't think the dollar will stop here. I expect it to go lower, and that will have big consequences for many different industries in the global picture. Again, I think the buck does not stop here! It may wobble, but the big picture has lots of important traits that I cover off in my newsletter.
I covered some of those ideas on the panel with David Keller for our recent "Charting The Second Half" panel.
Charting The Second Half
If you would like more information about some of the ideas and how this may be setting up for one of the best runs into the end of the year, I would like to suggest you check out this Your Daily Five video from StockCharts.com earlier this week.
Your Daily 5 July 21, 2020
As we head into the second half, I think it will be more important to see and understand some of the major theme changes as they occur. If you like some of my big picture work, check out the client special I am offering at the end of the Your Daily Five video above. Perhaps that is a fit for you!
Good trading,
Greg Schnell, CMT, MFTA
Senior Technical Analyst, StockCharts.com
Author, Stock Charts For Dummies
Want to stay on top of the market's latest intermarket signals?
– Follow @SchnellInvestor on Twitter
– Connect with Greg on LinkedIn
– Subscribe to The Canadian Technician
– Email at info@gregschnell.com


