"What's the matter with kids today?" Why are they so often confused, annoying, demanding, moody, defiant, reckless?
Since the COVID rescue funds were launched by all governments in the world, at all levels, with money they didn't have, the US Dollar has been declining. Not racing lower, but generally moving lower. After reaching some momentum extremes in August, the dollar started to consolidate in a sideways range and has been mildly rocking sideways since late July. That all changed this week, when it broke out of the trading range like a teen with raging hormones. $USD.
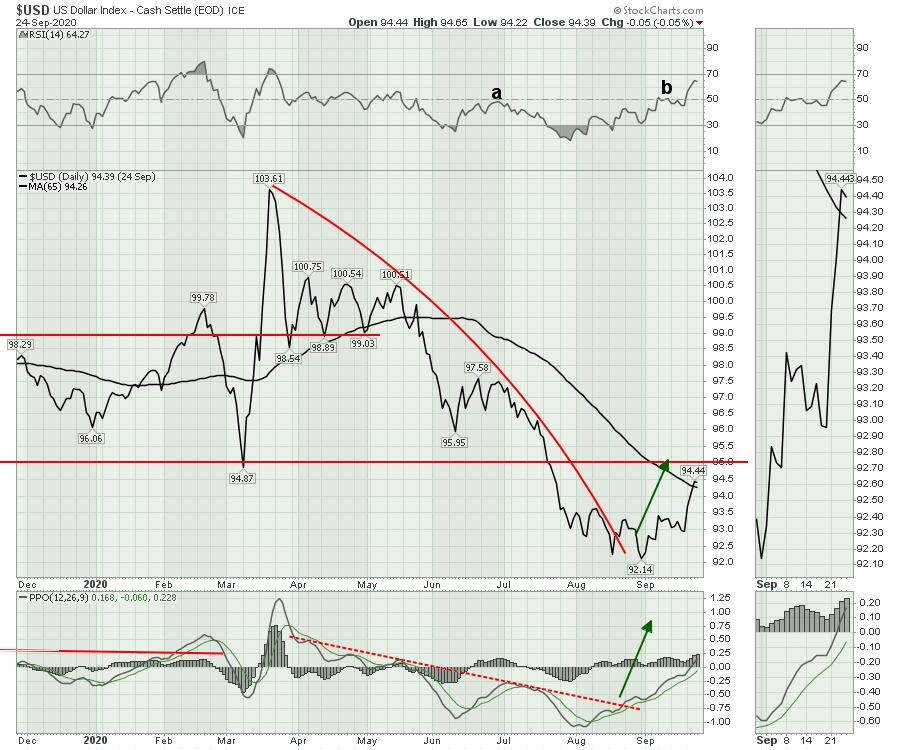
The green arrows on my chart were from my subscriber newsletter on August 21st. The Momentum indicator (PPO) in the bottom was starting to break the trend line. Needless to say, my timing was off by a month. As September was rolling along, the momentum indicator migrated up near the zero line and the US Dollar stayed in the channel between 92 and 93.5.
It was already declining last week like it was heading down to the bottom of the range to test the lows. On the weekend, when I looked at the chart, point ‘b' on the RSI looked a lot like point ‘a' on the RSI. Price was moving lower and the momentum indicator was stalling under zero.
Well, on Monday, the dollar soared, the stock market dropped, commodities got sold and, globally, charts were struck with large moves swinging wildly. That continued all through the week.
So what can we learn from this adolescent-sized mood swing? One concern I have is the RSI on the USD has now moved outside the range it was in for the stock market's entire COVID move up. That looks like a solid trend change on the daily chart shown. The PPO is well into positive territory with positive momentum. That's bullish for the dollar. The width of the consolidation was 1.5 between the August highs and lows. With the move now, we have moved up the same range as the consolidation, 1.5 to 95. If this was an ab-cd move (two moves of similar size), we are there. The dollar bottomed just before the September 3rd scalding of the tech stocks. If it was to find resistance here at the red line at 95, would we see the stock market stop testing lower lows and stabilize as we head into October Earnings Season?
I want to make sure you are aware of a special event I'll be doing on the 30th of September! I'll be hosting a special one-hour edition of Market Buzz titled the Move To Electric. You can register here!
The Move To Electric
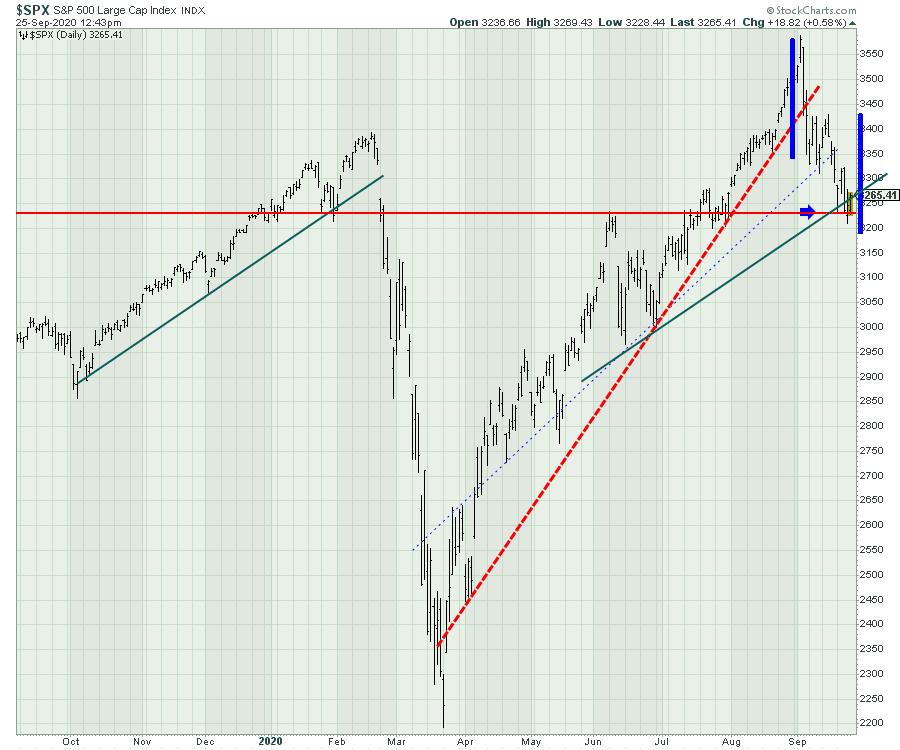
When I look at the world charts, they look like they are starting to plummet with the reality of the new normal. So that definitely sets the stage for broad global weakness. If the weaker economies are failing, they usually fail first. The strong robust US market tends to hold up better. It is not uncommon to have 4-to-6-week corrections. We are there now. A couple of factors are at play that make this a very interesting place for the markets to find support. Follow along on the chart below.
1) The ab-cd move structure shown in blue. The 1st impulsive move down has a bar beside it highlighting the size of the move. If we duplicate that bar and move it to the last high before this weeks' drop, it is roughly the same size. Then AB = CD.
2) The horizontal level of the beginning of the year has become a support-resistance line. There are reasons why that can be important technically. But, more importantly, we continue to bounce off this level on the $SPX. Can it hold?
3) I have drawn a green line on the upslope after the most recent lows in June. The reason this upslope is important is that it is the same angle of advance as the previous bull market advance in late 2019 -2020 before COVID-19 roiled markets. Can we return to a similar rate of advance? If so, that would be another reason to expect these lows to hold.
4) The two previous slopes were much steeper (one in dark red; another interesting trend line is the light, dotted blue line that included the highs during the COVID lows). While these trend lines were much steeper, there is nothing wrong with expecting the market to eventually return to the prior rate of ascent. So for all the gloom about the drop, this could be a reason to look for support here.
5) The bearish indicators are always raging when you have a big down week. But, more importantly, looking for areas of support can help.
Stocks like Shopify (SHOP) and Apple (AAPL) have been trading in a tight range. It is pretty safe to say that a large pullback in large-cap tech is a nicer entry, so institutional investors are looking for entries too after the pullback.
With the "raging teenager trade" up against resistance and the stock market at three different coincidental levels of support, there are reasons to at least expect a rally, as earnings will have improved from the second quarter for most businesses.
All that to say, the dollar seems to be sending shockwaves everywhere as the market dislocations happened. If that starts to stall at resistance, maybe the market can find footing here. Don't be too bearish after a big move down has already occurred.
I'll also be speaking at the Toronto MoneyShow on September 29th! Claim your free ticket here.
Also, I'll be speaking at the Wealth365 summit in October! Claim your free ticket here.

Good trading,
Greg Schnell, CMT, MFTA
Senior Technical Analyst, StockCharts.com
Author, Stock Charts For Dummies
Want to stay on top of the market's latest intermarket signals?
– Follow @SchnellInvestor on Twitter
– Connect with Greg on LinkedIn
– Subscribe to The Canadian Technician
– Email at info@gregschnell.com


