We continue to be in a bull market. We continue to expect more stimulus to help this rally. We continue to expect the vaccine to help the economy heal. We continue to expect higher prices.
Two of the questions I/we have to reckon with is:
- Each rally has lower momentum shown on the PPO. Why?
- What is shrinking ($SPX) and exploding ($COMPQ) volume telling us?
S&P 500
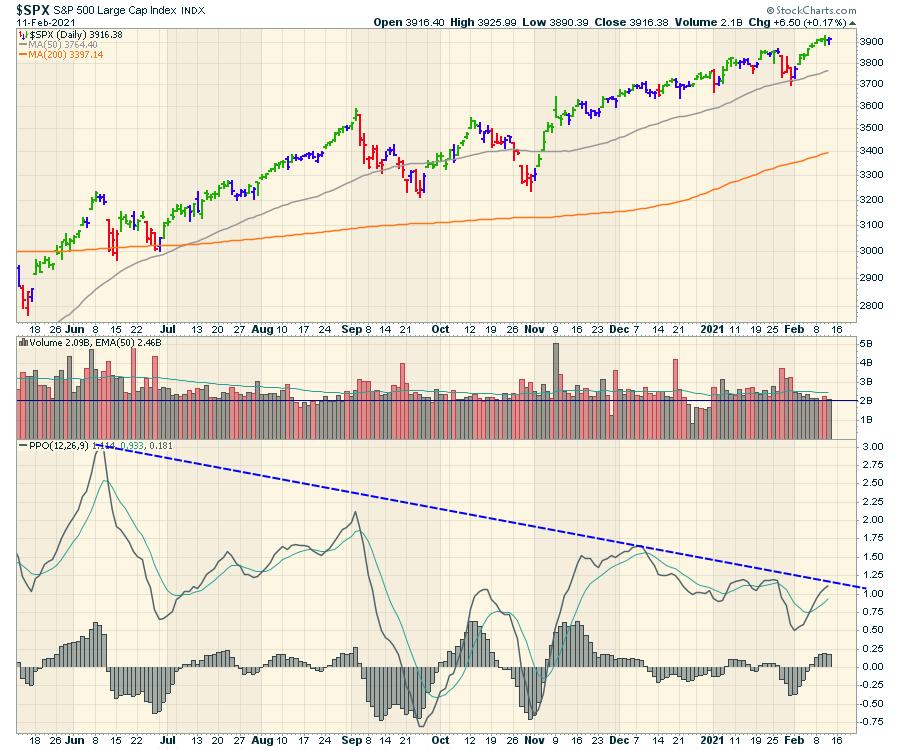
We are testing this down-sloping PPO momentum trend once again. The PPO does not use volume in its calculation, so this is not a volume measurement.
The volume on the $SPX has been getting lower each day throughout this most recent rally (February). Wednesday was the first marginally down day on marginally higher volume. Larger market weakness at the end of January saw the volume spike. What I notice is that the volume in these large-cap names has been below average (green line on volume) for all of February. That doesn't make it a sell signal. It could just be everyone is happy with their current position.
Whenever I see very quiet or very large volume, it makes me ask the question "why is volume dropping?" I put the horizontal line at the low volume level of Tuesday. For me, it is something to watch.
S&P 100
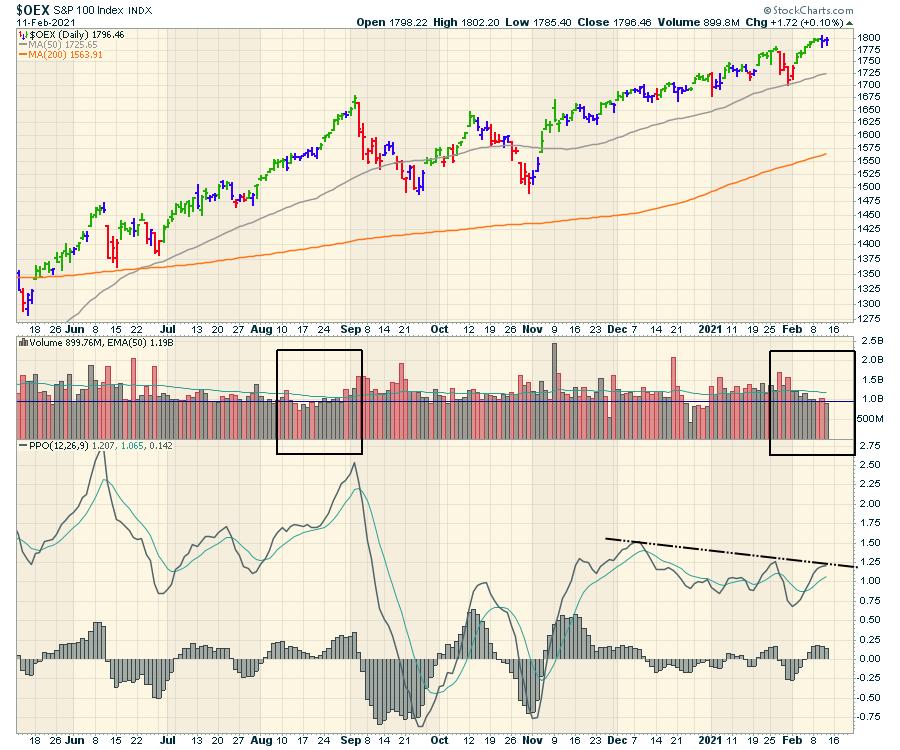
When we narrow the group from S&P 500 to the S&P 100, the momentum picture doesn't change other than the PPO momentum surge into the September high. The large caps had a spectacular surge into the September intermediate top. So, as the PPO touches and tries to break this three-month trend line, I am interested to see if it can make a momentum wave above the 1.5% level if it does break through. The largest 100 stocks is a store holding of institutional investors typically.
When we look at the volume, the February and August runs have a few things in common. They both had big multi-day up-trend runs. In August, the volume was accelerating into the high, whereas the current run has declining volume. January had solid daily volume, so I am unsure why the sudden change in February to the volume trend. Thursday, February 11th had lower volume than Tuesday. These changes are all worth watching.
Nasdaq Composite
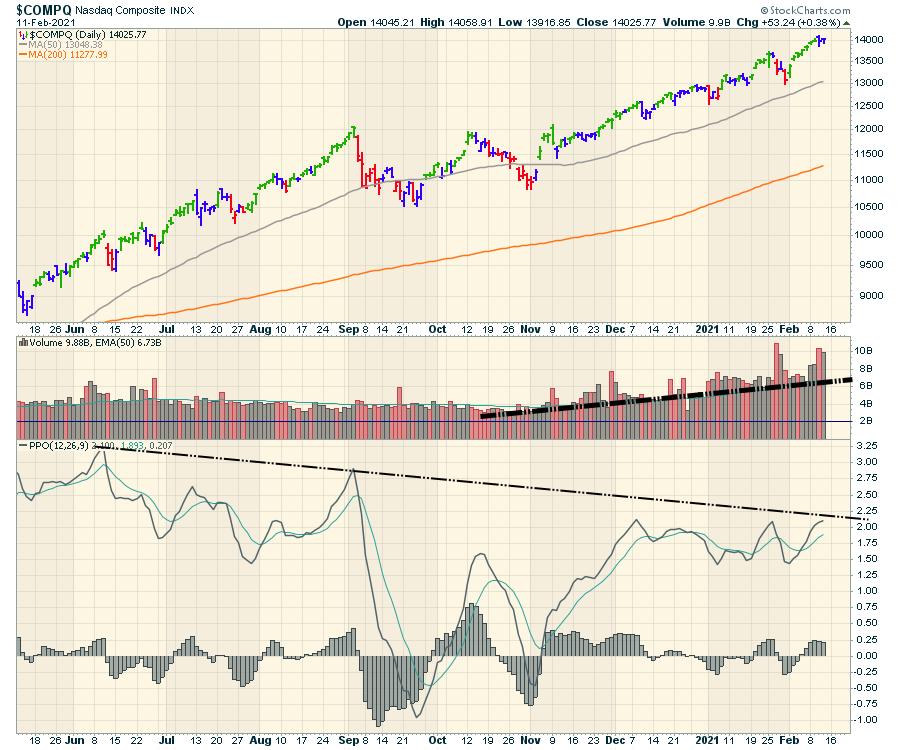
But then we have the other side of the fence. The Nasdaq Composite, which is all the stocks on the Nasdaq, has explosive, absolutely explosive volume. Notice the recent surges to 10 billion shares a day! That is very far above the 4 billion share averages from May through September.
The momentum trend on the PPO continues to decelerate.
Big Picture Comparison
I have spent a lot of time analyzing the wider picture.
- The amazement of the number of SPAC releases - which is at 130 in the first 30 days of 2021- has to be some sort of reckless signal where investors throw money towards companies without a business underneath. Former baseball players launching a massive SPAC, a football player SPAC, 2 ladies launching a massive SPAC, Gaming SPACs, enterprise software SPAC, Sports and Media SPAC, Israel SPAC, upsizing a third SPAC for the Roths, Serial Launches second SPAC, Perspective launches 4th Healthcare SPAC, Education SPAC, HR Management SPAC, Growth fund SPAC, Infrastructure SPAC, Power Grid SPAC, Apollo Strategic Growth SPAC (is there an unstrategic SPAC!). That just gets me to Tuesday's (Feb 9) announcements on Thursday, Feb 11.
- The "Attack of the Reddit" trader reminds me of the day-trader boom of 2000. Simultaneously, the electric vehicle mania of companies surging 500% without an auto is bizarre. Tesla (TSLA) trading at huge multiples while the paint doesn't match and most of their profits are from carbon credits. I'm no expert, but that doesn't seem sustainable. They've had to give their technology to China to get into the market. That doesn't usually end well. Seen that movie before. Intellectual property rights? I'm not holding my breath. See Hauwei/Nortel.
- Company after company is trading on the highest price/earnings ratio ever, even though the company will not be back to former profits for years.
- The gamification of stock picking like it's my family playing Pokemon Go and going into a gym.
- The cash calls by the clearing houses on Robinhood as they see massive swings in margin.
- Stock after stock surging 100% in days only to retrace quickly off the highs. It's almost like stocks lining up for funnel drinking like students in college dorms. Maybe that was so last year.
- Stock after stock goes through the news up and news down. Rookie investors getting squeezed up and down. Experienced investors selling a stock on 3-month lows and then it runs 70% like that is the new real value. The Najarians tweeting a list of 90% call buying in stocks day after day. Chamath in interviews day after day. Cathie with interviews day after day. Fund flows into the ARK ETFs increasing X times per quarter.
- The launch of new funds with smaller definitions to keep catching the hot trends. Autonomous, Electric, Infrastructure, battery, vaccine. The definition is so narrow they own but a few names. But hot names nonetheless.
- Everything uses semiconductor chips. There is a shortage of semiconductor chips. A big shortage. A company estimate suggests will this slow revenues by $2 Billion. If everybody is slowing revenue because of chip shortages, how do this keep up with the euphoria? Maybe it's bullish for semis, but not if it stalls growth across the economy.
So what does it all mean? It means we are closer to the euphoria phase than the stability phase of a bull market. But it can last another year. Or can it? Can volumes keep spiraling up 2.5 times in 6 months on the Nasdaq?
Blow me off as just another bear. That would not be fair, as I just had my best year ever. I have been riding and recommending energy stocks since last fall. I have been riding and recommending metal stocks. I have been riding and recommending EV or cleantech stocks. I am bullish in a bull market.
Nasdaq Composite 2021 vs. Nasdaq Composite 2000.
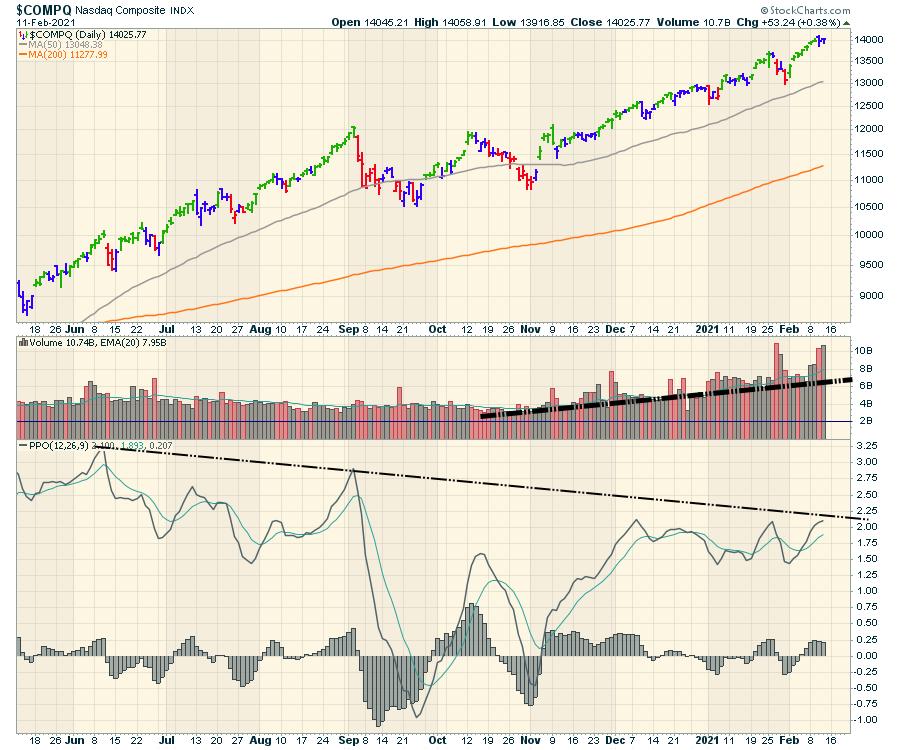
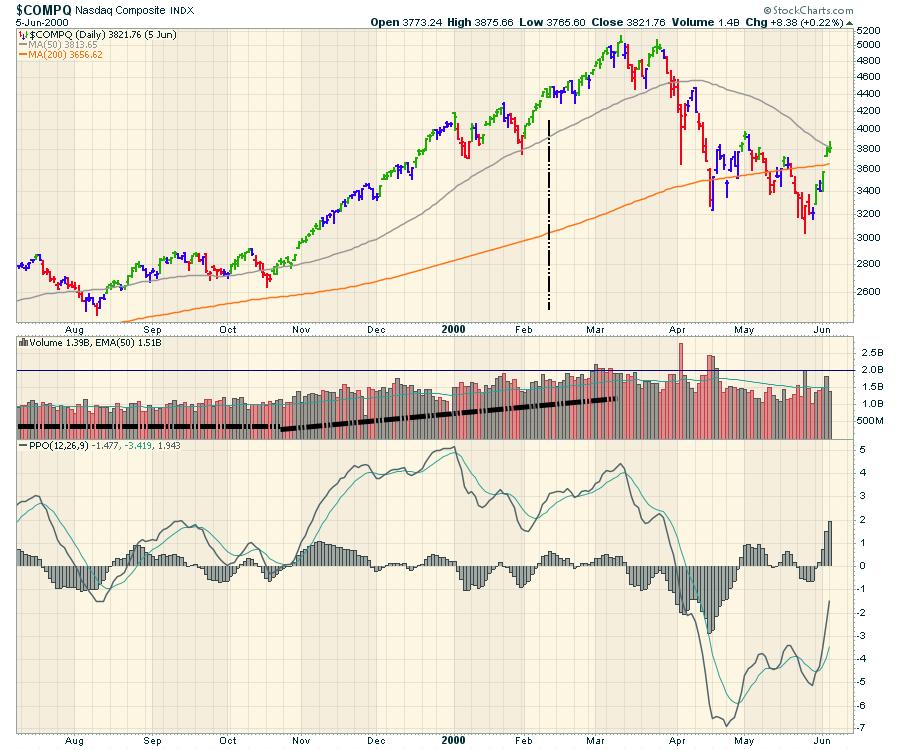
Below is the current 2021 Nasdaq Composite chart right above the 2000 Nasdaq Composite chart for easy comparison. I changed the moving average on the volume to 20 days (1-month) from 50 days on the charts above. I marked February 11th on the 2000 chart with a black vertical line.
- 2000 market - regular text
- Current market - italics
A few things I notice:
Average volume
In 2000, the average volume ramped up from a summer period of 1.0 billion to a March 1.6 billion. A 60% increase.
After a sustained run from October to now, the average Nasdaq composite volume has doubled the summer level from 4 billion to 8 billion.
Spike Volumes
The five continuous days in early March 2000, with volume above 2 Billion, was 10% higher than previous peaks and double the summer time average.
February 2021 - 4 recent stabs over 10 billion within a few weeks. These peaks are 20% higher than the peaks in November, December and early January. These 4 peaks are 2.5 times the summer average volume!
PPO
The PPO back then had a lot more momentum on the daily chart at 5%. There were three momentum peaks before it failed (Nov, Dec, March). It made a lower high before collapsing, but it doesn't have to.
Currently, our PPO momentum is only 2% on the daily, so it doesn't look as extended. The long black downtrend in momentum is declining as volume surges. But this is also the third test at this momentum high around 2%.
The year 2000 ⬇️.
Why the year 2000?
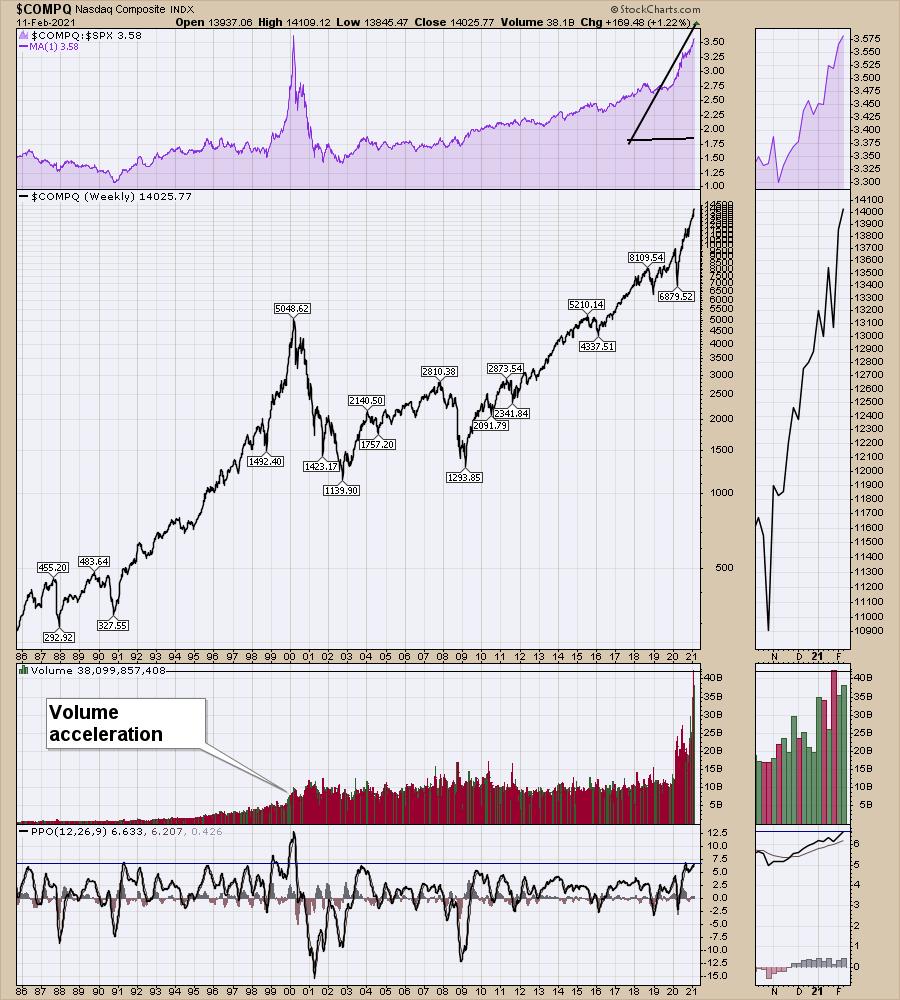
One reason I keep thinking about 2000 is the monthly and weekly chart PPO momentum readings point us there.
- The top panel is the outperformance of the $COMPQ compared to the S&P 500. That doesn't look sustainable.
- Price of this broad index is up a stellar 100% since the March 2020 lows. In 2000, it was a triple off the 1998 lows.
- The third panel shows volume. Does this look like blowoff volume?
- The fourth panel is momentum. While we are well below the peak, we are at the typical topping-out spot and we are on our second momentum wave. The first one was in September. It's extremely rare to get to this level once, but twice is pretty amazing. That doesn't mean it is done.
Conclusion
If the SPAC's and 10-year-old traders being covered on TV don't make us feel like we are in special times, the volume certainly does. I don't know how close to a significant top we are, but I would suspect closer than we think.
Volume
At some point, it is exhaustion and we find a lack of buyers. 10 billion share days and 8 billion share days are amazing.
- Week to date volume at 38 Billion, and we still have Friday to go.
- Anything over a 4 billion share day Friday and we'll log another 2021 "the most volume ever" in a week.
- 10% above the previous record of two weeks ago.
- We are also hitting these high volumes on up weeks, whereas the 42 billion week was on a down 4% week.
Call me a pessimist, but this can only be described as moonshot stuff, and it probably ends in a GameStop (GME) chart shape. Stay laser-focused here.
Good trading,
Greg Schnell, CMT, MFTA
Senior Technical Analyst, StockCharts.com
Author, Stock Charts For Dummies
Want to stay on top of the market's latest intermarket signals?
– Follow @SchnellInvestor on Twitter
– Connect with Greg on LinkedIn
– Subscribe to The Canadian Technician
– Email at info@gregschnell.com


