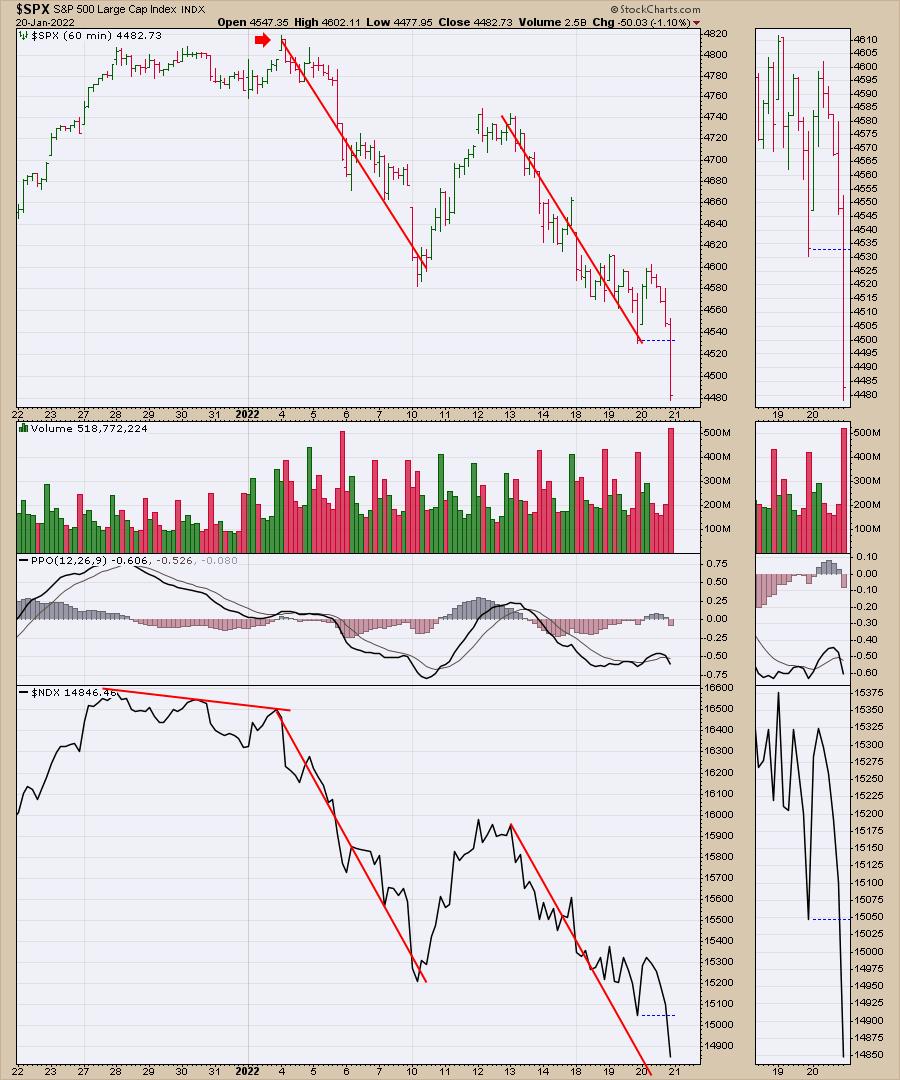
It's been a rather traumatic start to 2022. The $SPX lodged a new high for the year on the second trading morning of 2022, and it's been moving lower since then. Ouch! I've marked the chart up with a red arrow pointing to the top. The red lines are equidistant moves. It is not uncommon for the market to make moves of roughly the same distance before bouncing. There is a particular style of trading around these moves. This was looking like a potential rally point this morning, but it rolled over hard. The market slammed lower as the bottom fell out and the market dumped into the close. Yuck.
The S&P 500 index has dropped down 7% since the start of the drop, whereas the Nasdaq is down 10%. Those are pretty significant drops to start the year. On the chart below, the $SPX 200-day moving average (DMA) is at 4427.63, as shown by the legend. That is about 65 points below the close. We moved down 120 points in the last hour.
I like watching the 200-DMA for support at that line on the chart on the first surge lower to that level. For those new investors, I am saying I want to be prepared to get long after a big downdraft, and the 200-DMA is a good location to watch for a reversal from down to up. The green line shows on the Nasdaq, but it is just below the price action so far on the $SPX.
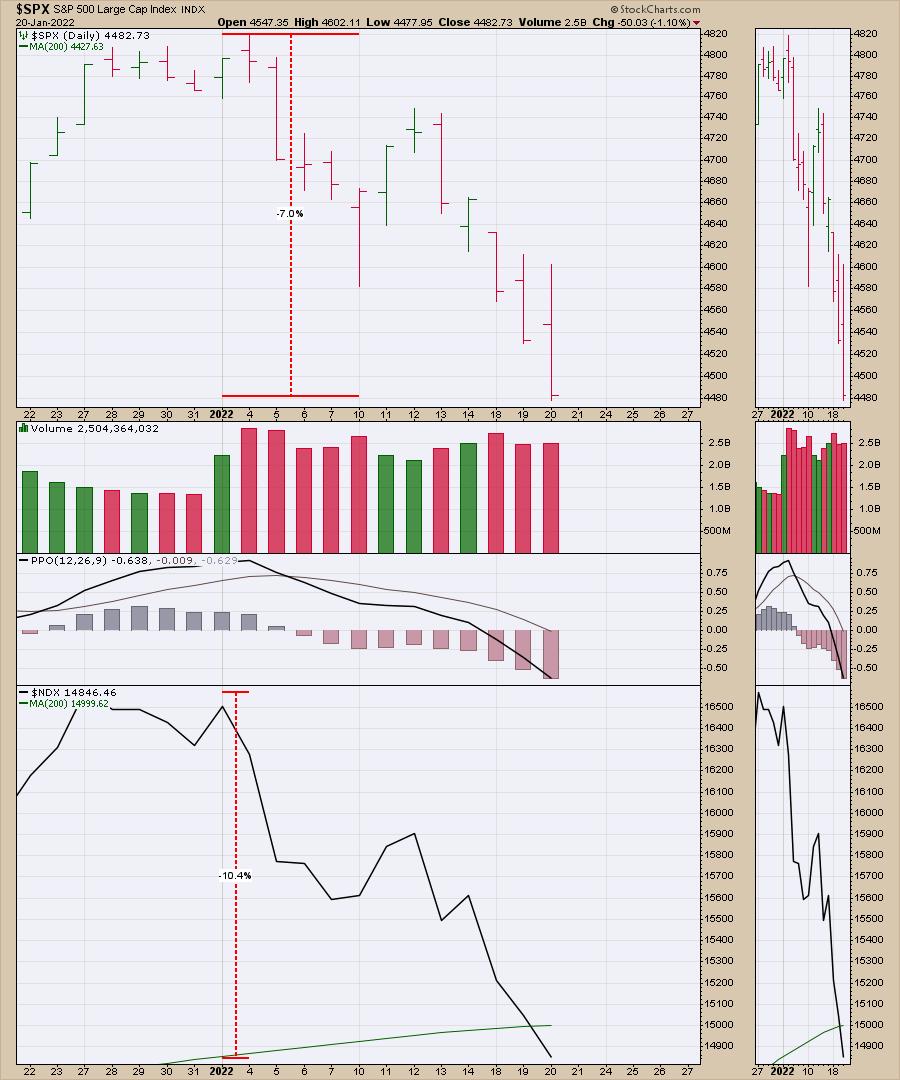
The Nasdaq 100 -- $NDX -- sits below the 200-DMA (14999), shown in green. For me, this is a good place to expect some sort of support, but it has not shown up yet.
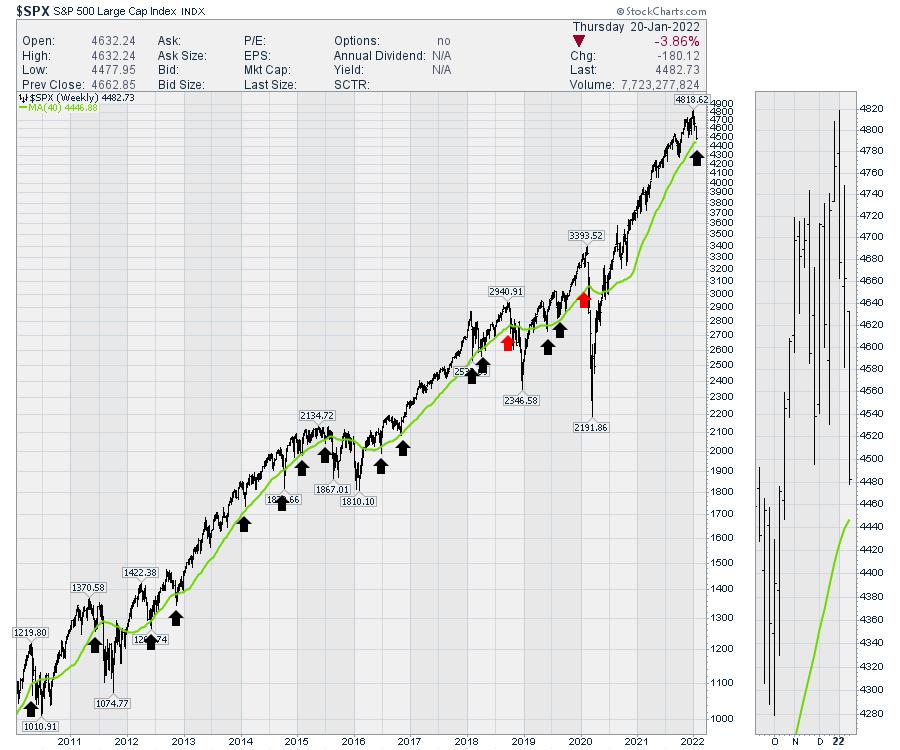
Below is an example for the $SPX, using the weekly equivalent to the 200-DMA, which is the 40-week MA. The black arrows mark bounces at the 40-WMA, as the market made its first pullback to touch it.
I also like to keep track of options expiration days, and each month I draw another line on the chart. It occurs on the third Friday of the month, anywhere from the 15th to the 21st. In December, it marked the short-term bottom for the Santa Claus rally. In November, it marked the top of the two-month rally. In October, it marked the breakout above the downtrend. In September, the market dropped quickly and chopped around for a month. In May, June, July and August, it marked a reversal of small downtrends.
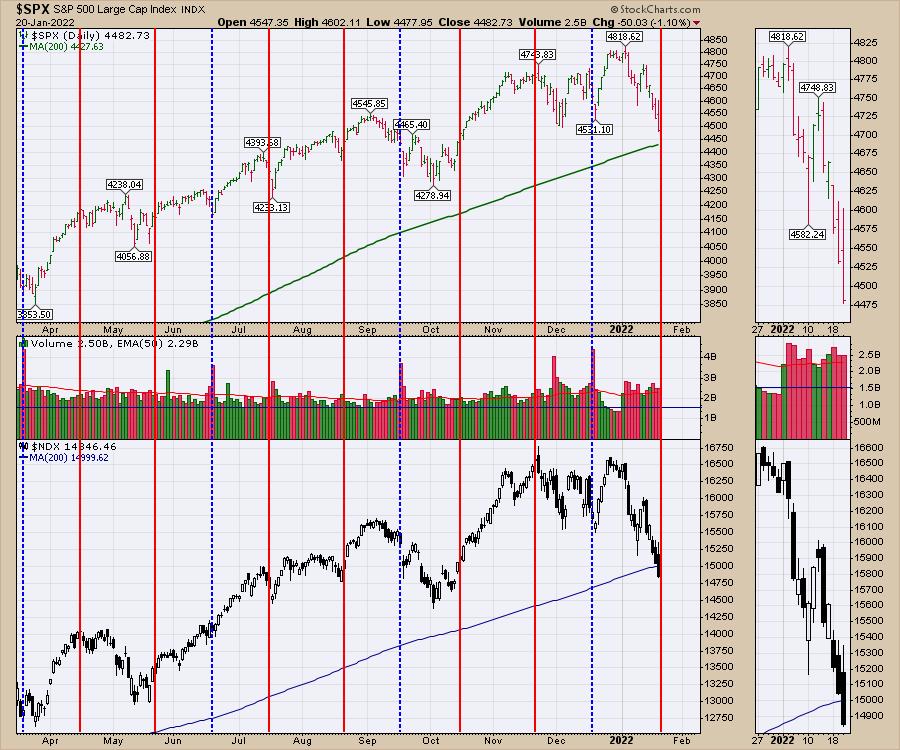
Hopefully I've made my point that it is a good date on the calendar to be aware of.
I recently published some articles, suggesting the market breadth is shaping up for a larger correction. When markets correct (drop in an uptrend), the drops are faster than we think, and the rebounds are quick and vicious, forcing short positions to cover, enhancing the speed of each rally. It is important to remember the market does not typically make 20% drops all in one blow, but in a series of waterfall events.
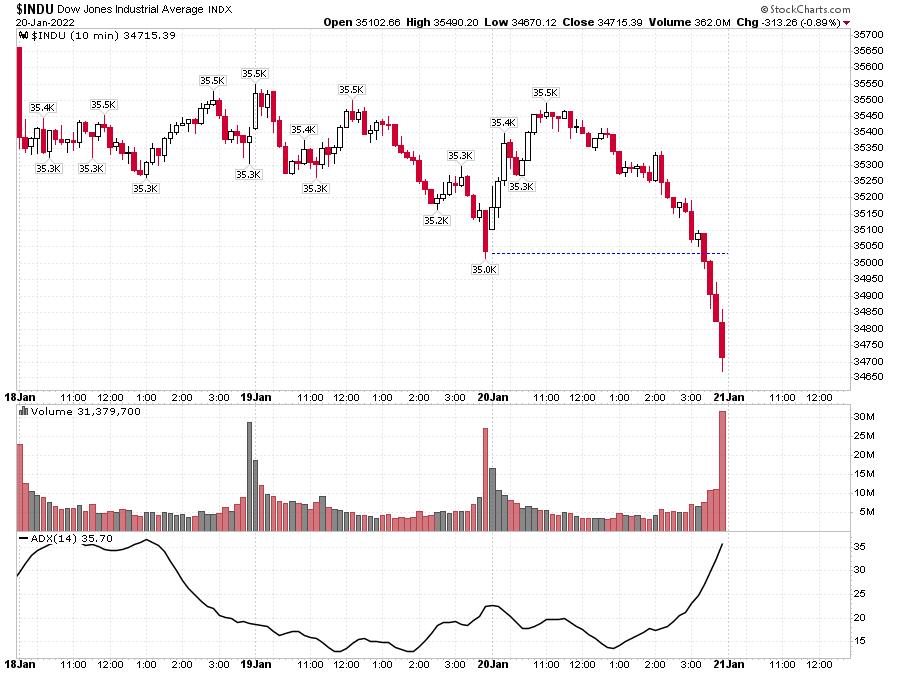
There are exceptions. In 1987, the market was down for 7 days in a row, then fell 25% in one day. We now have circuit breakers to prevent that kind of decimation, as well as automated trading systems that usually try to rally as the market approaches these big downsized moves. Thursday's Dow move was 850 points from high to low. I have noticed that 1000-point moves on the Dow tend to be reversal days. That doesn't happen very often. It is statistical outlier days that set up reversion to the mean trades the other direction. Will Thursday's price action prove to be just that?
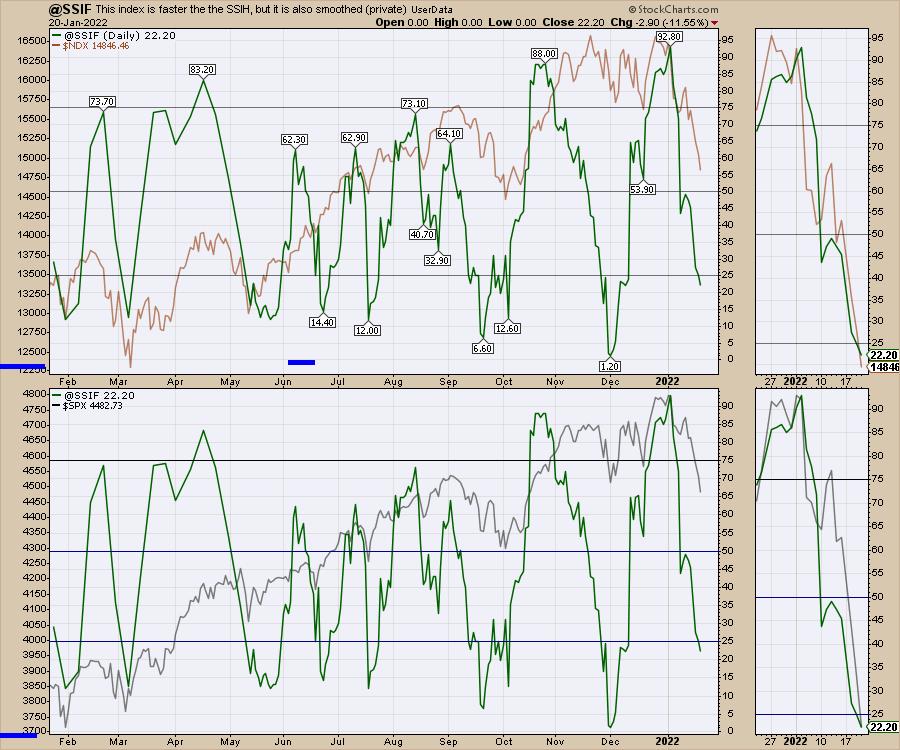
The bears are starting to get comfortable. I like to use my Schnell Strength indexes to help spot reversal points higher. This is still declining, but it is below 25%, which is the zone where we want to be at least looking for a bullish reversal. Last year, we had 8 of these buying lows, which gave us an excellent opportunity to get long as it moved back above 25%. It's still difficult sometimes, but at least we can use a tool like this to help us buy when we are uncomfortable and sell before it gets very weak, like early in 2022.
If you would like to see more of the work we do at gregschnell.com, check out the free stuff tab there. You'll find some original content to help keep you on the right side of the trade.
On December 21st, I produced a video with StockCharts.com talking about the need to be ready for a more difficult trading environment in 2022. That seems to be playing out. You can also check my Your Daily 5 video from earlier this week, as well as the latest Market Buzz, for more information.
So it has been all down hill for the indexes in 2022. I'm looking for the ski-lift taking us up to start soon! I don't know when it will turn, but our tools will help us figure that out. If you'd like some perspectives as that starts to happen, consider a trial at GregSchnell.com.
Good trading,
Greg Schnell, CMT, MFTA
Senior Technical Analyst, StockCharts.com
Author, Stock Charts For Dummies
Want to stay on top of the market's latest intermarket signals?
– Follow @SchnellInvestor on Twitter
– Connect with Greg on LinkedIn
– Subscribe to The Canadian Technician
– Email at info@gregschnell.com


