I published an article recently about the rails gently moving higher, only to have Friday's price action wipe out most of the prior month's gains. That is so frustrating when it happens, but it happens. However, it is always worth looking deeper to see if it is just a bad day.
There have been some dagger moves lower on CP Rail before, but this has cancelled the breakout and is now backtesting support. This pattern is not uncommon, with a breakout occurring, price running up, then retracing back to the point of the breakout. However, it is not usually a one-day move, wiping out one month of price action.
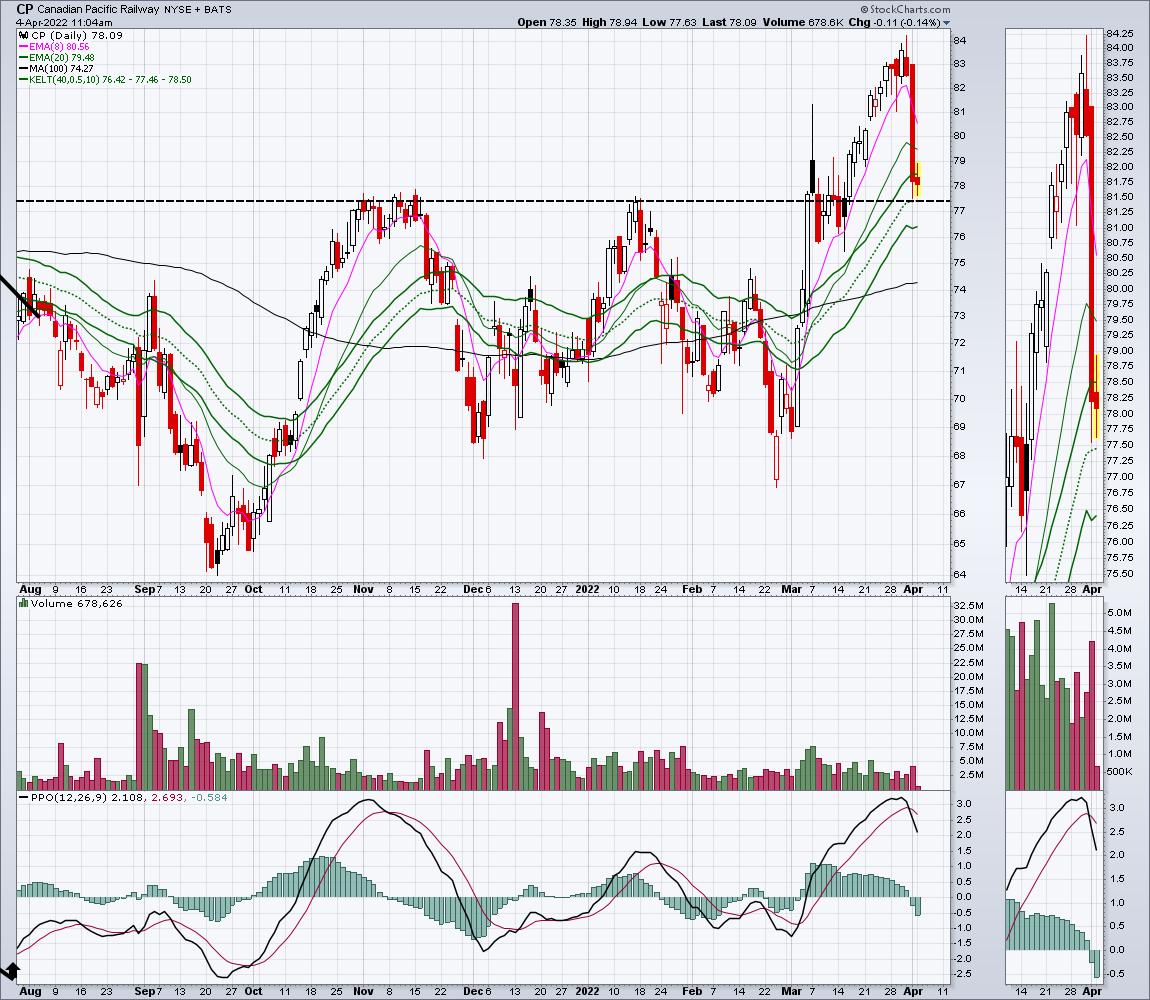
I think what makes this case different is that every one of the rail companies slammed lower on Friday as one of the logistics companies said they are seeing a freight recession. That comment really hammered the trucking industry and the railway stocks.
During my weekend review, I noticed the truckers industry group made new five-month lows. This morning, the chart broke below the October low.
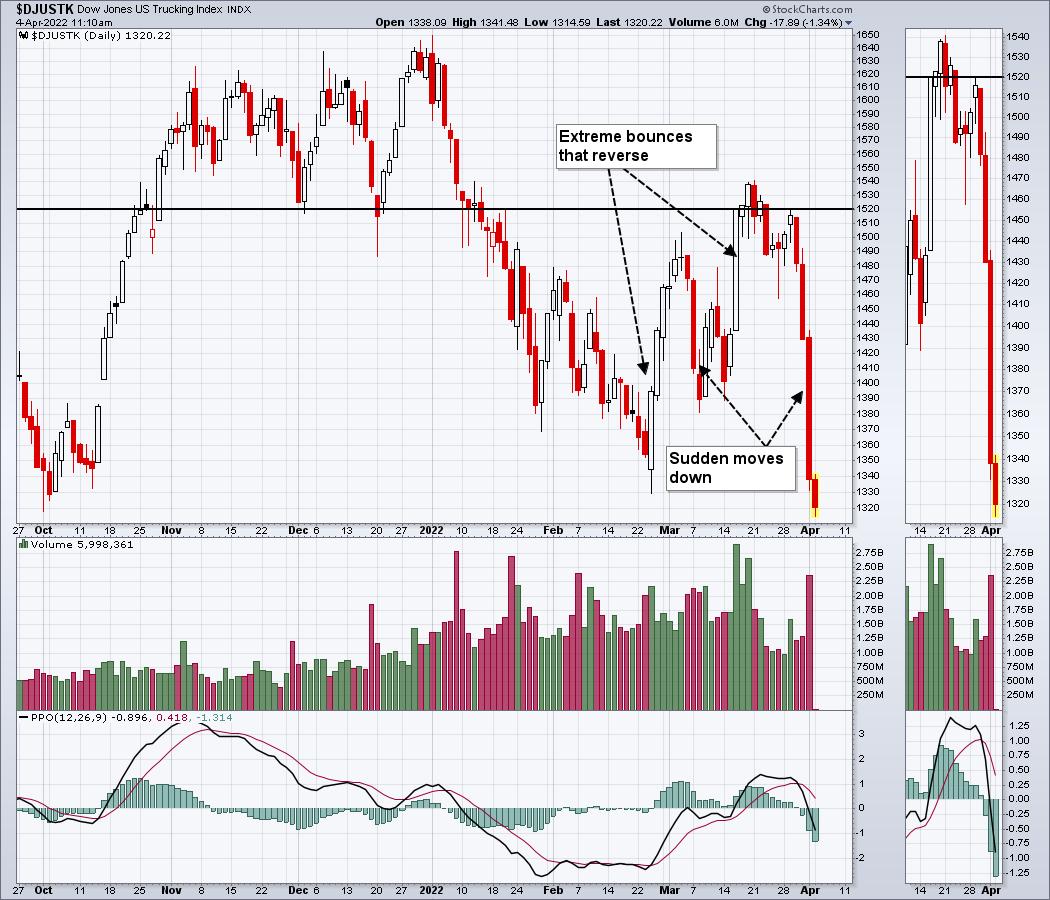
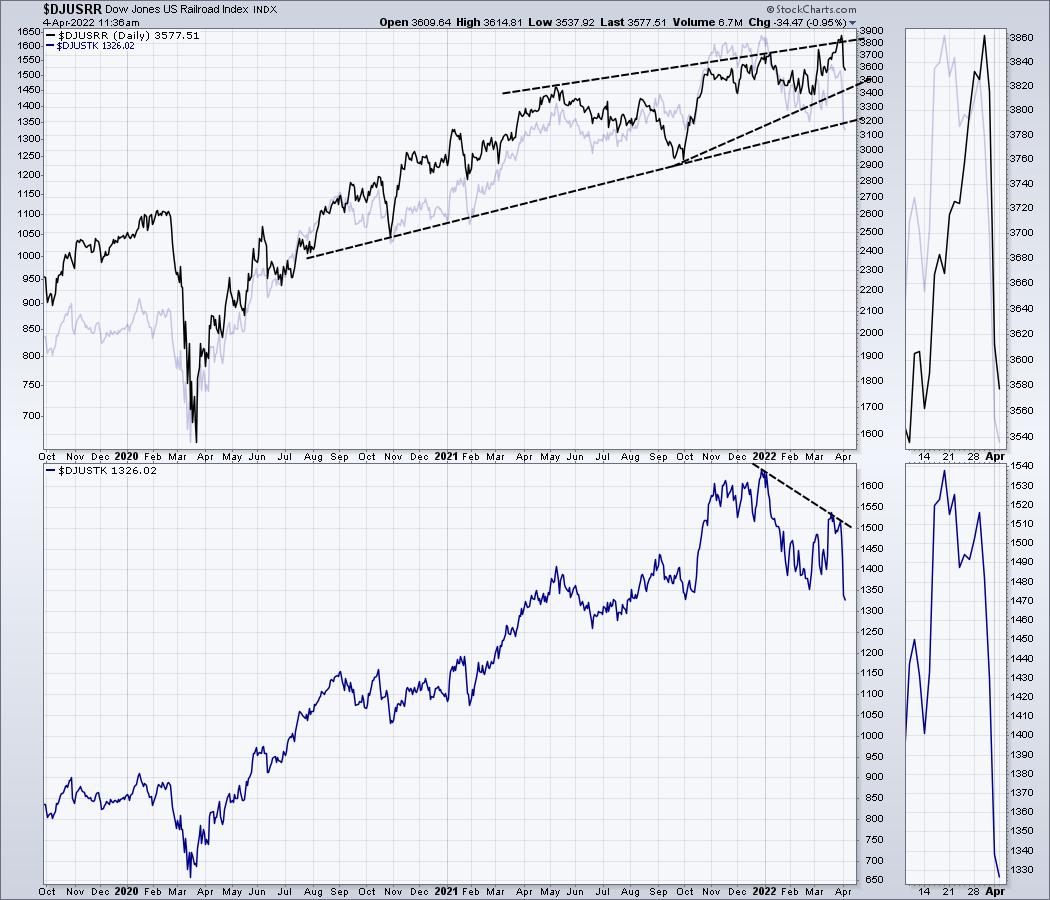
How far back do we have to go to see a low at this level? Expanding the chart out gives us quite a bit more information.
- First of all, the chart now has a distinct top in place.
- The second thing we can see is a back test at the trend line on March 21st.
- Truckers had a nice uptrend that is clearly broken.
- The move down in April takes us to September 2021 price levels.
- The next level of support is the June lows.
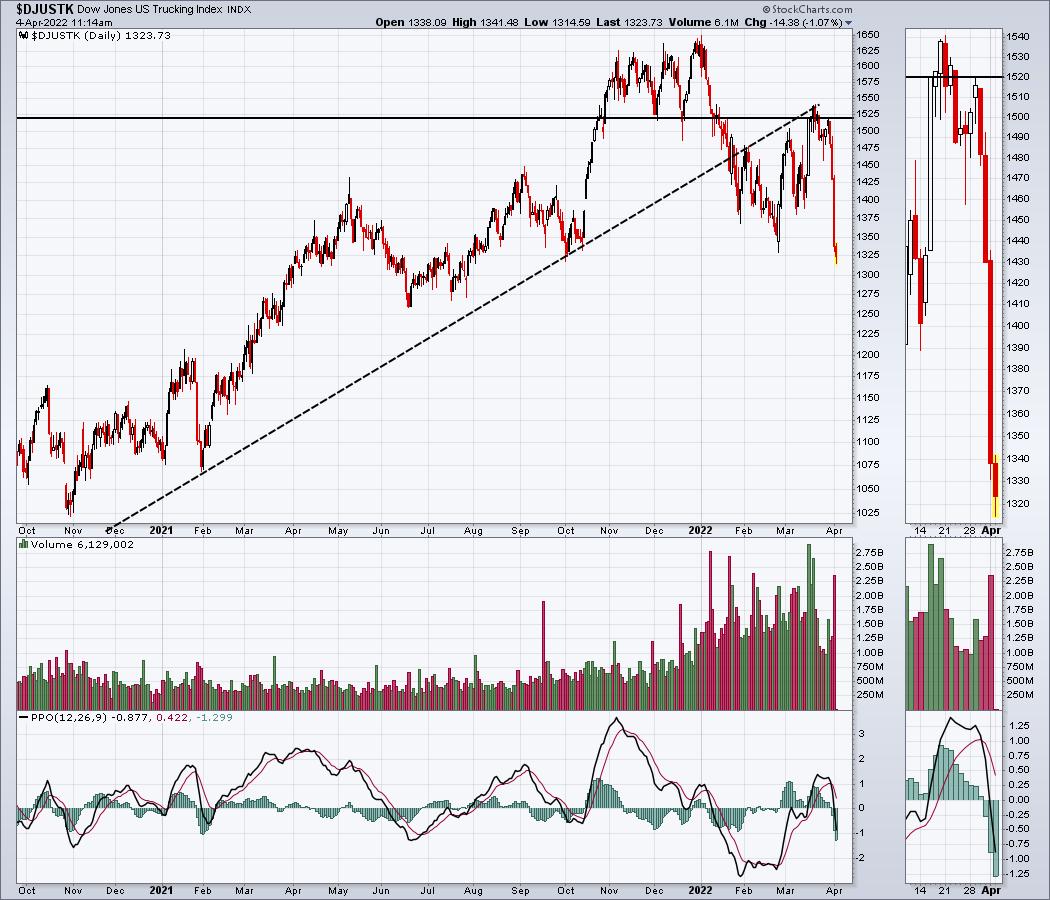
The volume is also showing an extreme change in character compared to the uptrend.
So trucking looks ill. Can it give us a clue to the railway stocks?
Here is a daily chart of the railway companies. I put a correlation indicator on the bottom that shows how correlated they are over a 20-day period. We can see they have a very high correlation, which is to be expected.
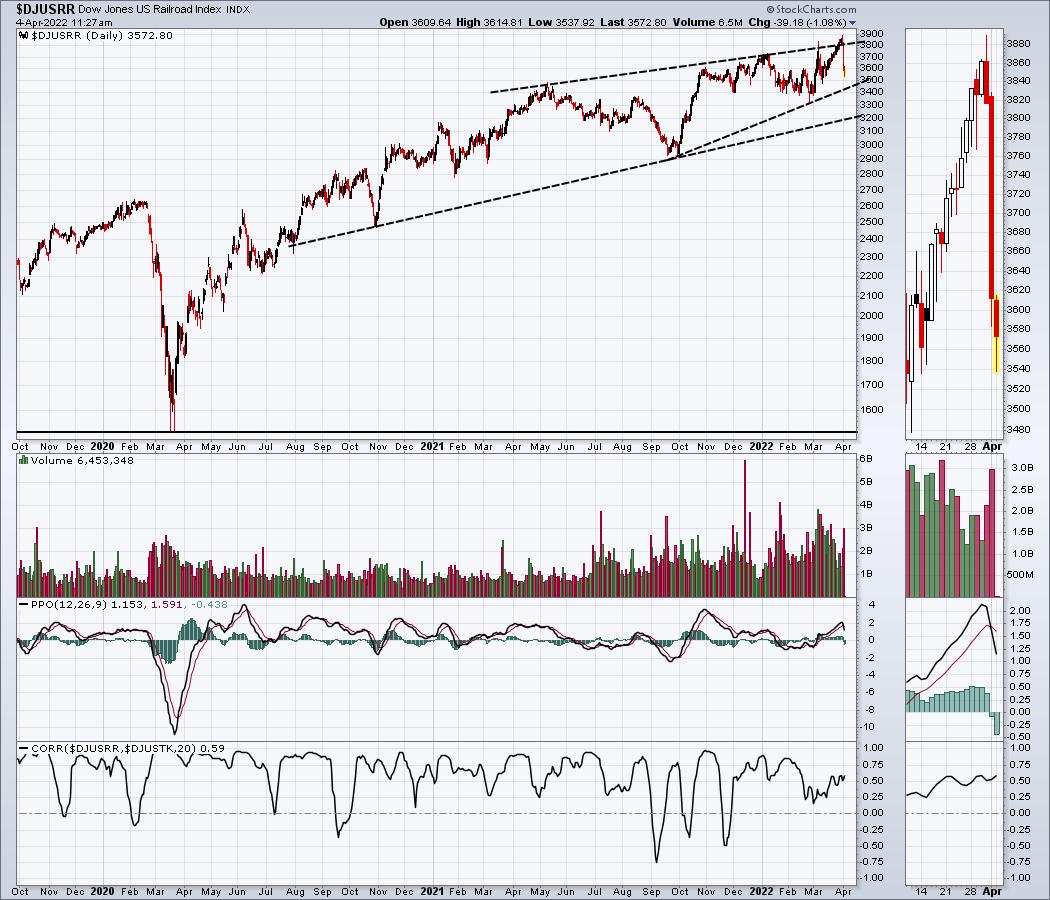
So if trucking is starting to break to lower lows, it is a good time to be careful with the railways in my mind. When I wrote the article 10 days ago, both indexes were sitting near the top of the rally. As the industry changes, so do the charts. The lower high on the trucking chart looks a lot more ominous than just a few days off side.
There is a lot going on under the surface of these markets. The shift of gears in the transports from uphill to downhill is a worrisome one.
We continue to roll out new trading ideas as the market moves from down to up. If you would like to try the information at Osprey Strategic, head over to the home page and subscribe at OspreyStrategic.org.
Good trading,
Greg Schnell, CMT, MFTA
Senior Technical Analyst, StockCharts.com
Author, Stock Charts For Dummies
Want to stay on top of the market's latest intermarket signals?
– Follow @SchnellInvestor on Twitter
– Connect with Greg on LinkedIn
– Subscribe to The Canadian Technician
– Email at info@gregschnell.com


