Energy investors have been watching a crisis emerge in Europe, while the world tries to share tight supplies since the Russia/Ukraine conflict.
On the back of the war on February 24th, oil spiked. Following the immediate spike, oil and oil names have wandered sideways. Even off the June lows, oil and oil names continued meandering. I did a Market Buzz show on Wednesday describing why investing in oil is hard right here. That show can be seen here:
Why Energy Investing Is So Hard
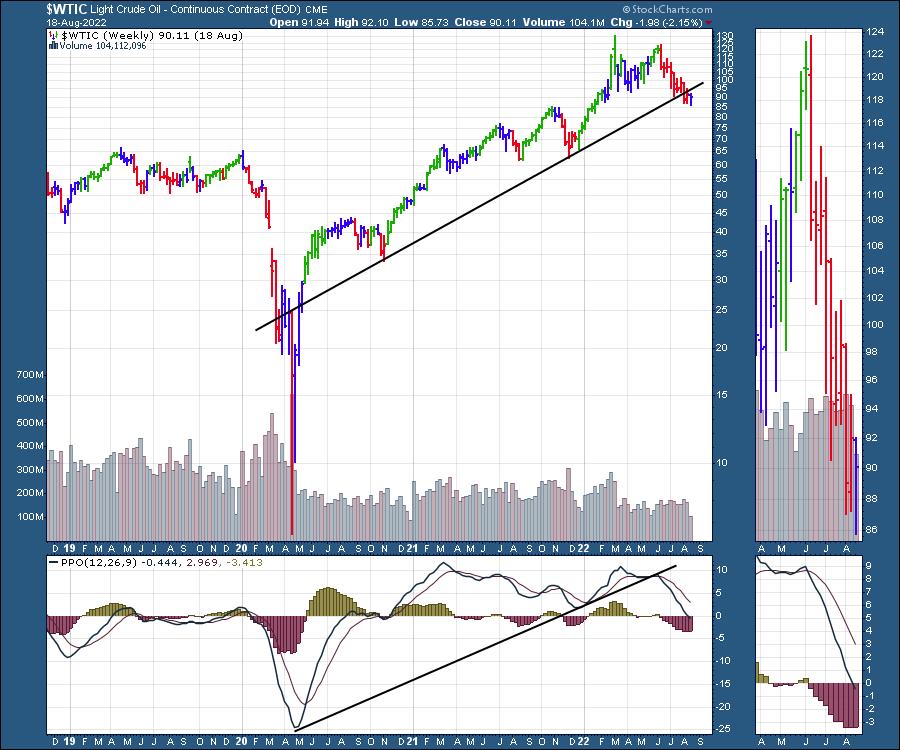
A look at the crude oil chart shows the problem. The two-year trend line is cracking after the double top pattern emerged in June. Positives for the chart are that the PPO has just returned to zero and, if this is going to start to trend higher for the 4th quarter, it is not uncommon for a momentum indicator to cycle back to zero before starting the next rally.
The chart for Natural Gas is really only for futures traders, as the tracking ETFs are a problem with the market open only 25% of the time. The price is swinging wildly week to week and overnight gaps are huge.
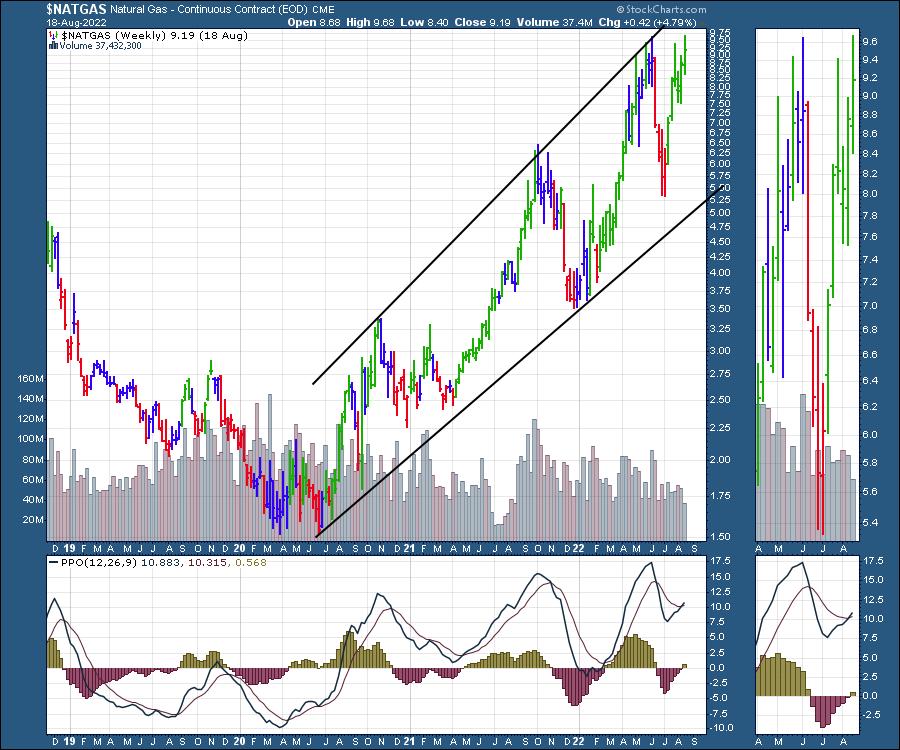
High volatility makes high rewards both ways!
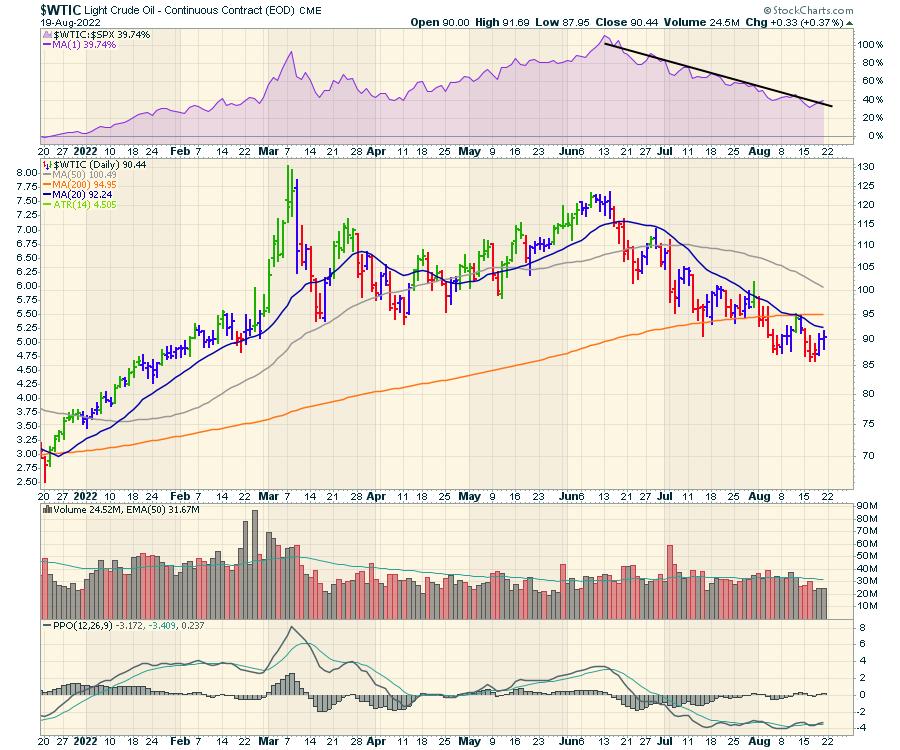
Looking at both crude oil and Natural Gas on the daily chart bring some other price action into play. First of all, we have the crude oil chart. The rate of descent has been slowing, and we can see that on the momentum indicator which is negative but flat. However, until crude oil actually starts to outperform the $SPX to the upside (purple area chart), it seems the selling of the SPR (strategic petroleum reserve) has worked to moderate price acceleration. The low volume on oil contracts also makes it a potential turning point here to watch closely.
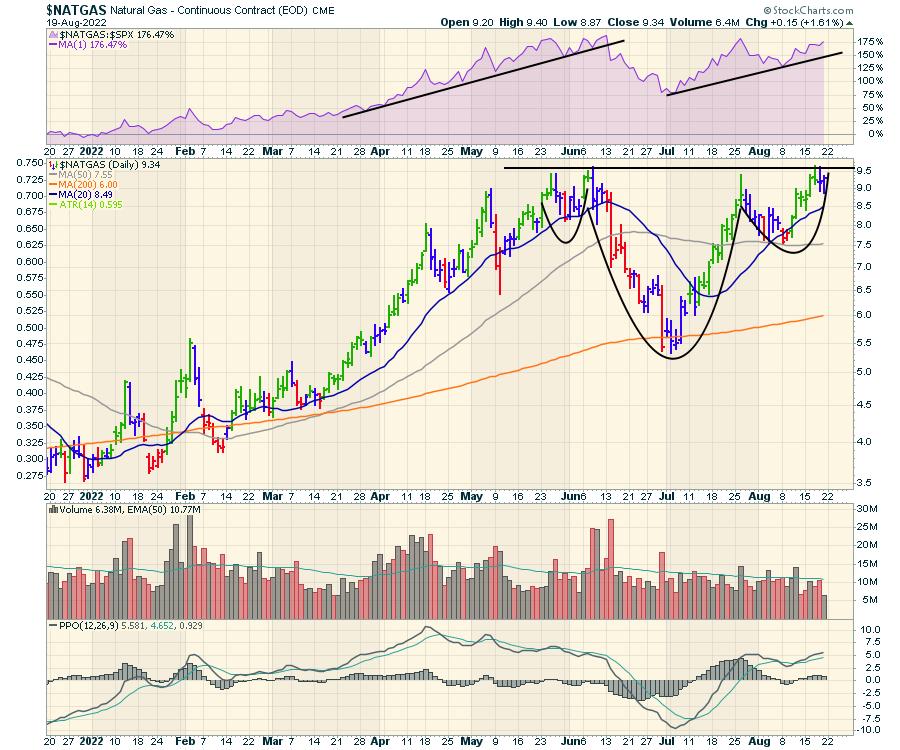
Natural Gas is another world compared to the oil chart. The commodity has been outperforming the $SPX, as seen on the purple area panel. Price is building a head/shoulders base with a $9.50 neckline, suggesting the move to the upside could be $4 or $13.50.
But I titled the article as calling crude oil's bluff. Why? Well, XOP is holding up while crude oil has been drifting lower.
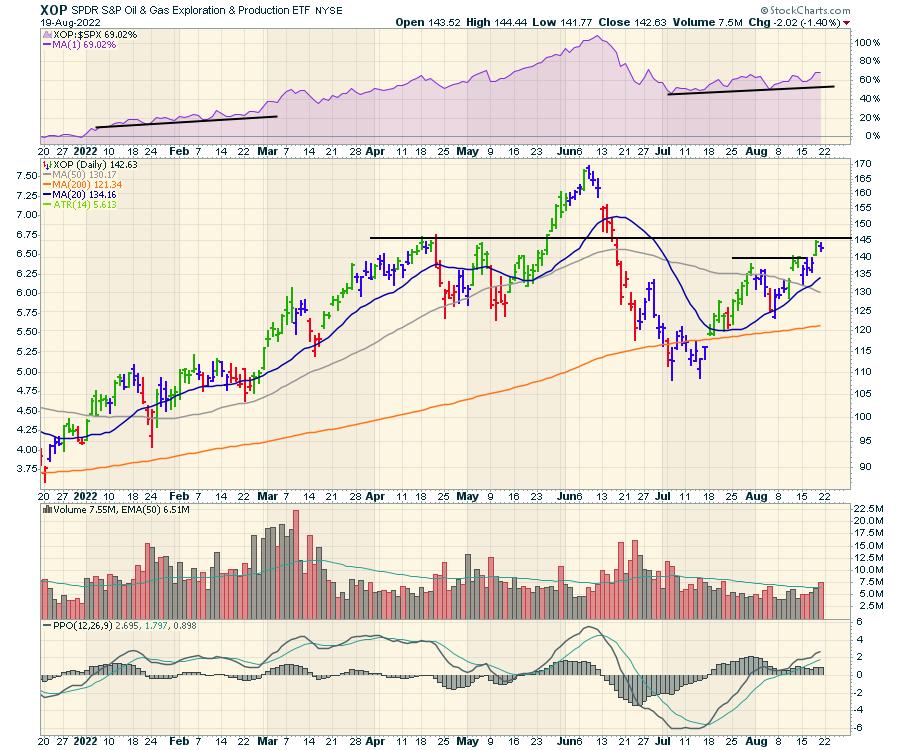
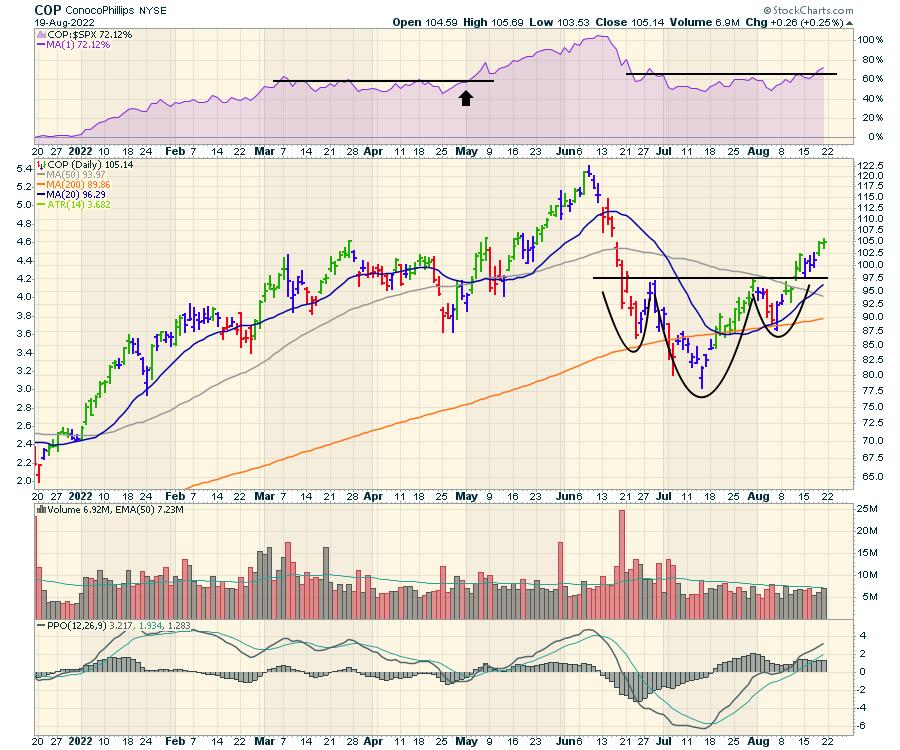
A few of the associated stocks are starting to break out of the basing funk they have been in for months. COP is a nice example.
Another is OXY.
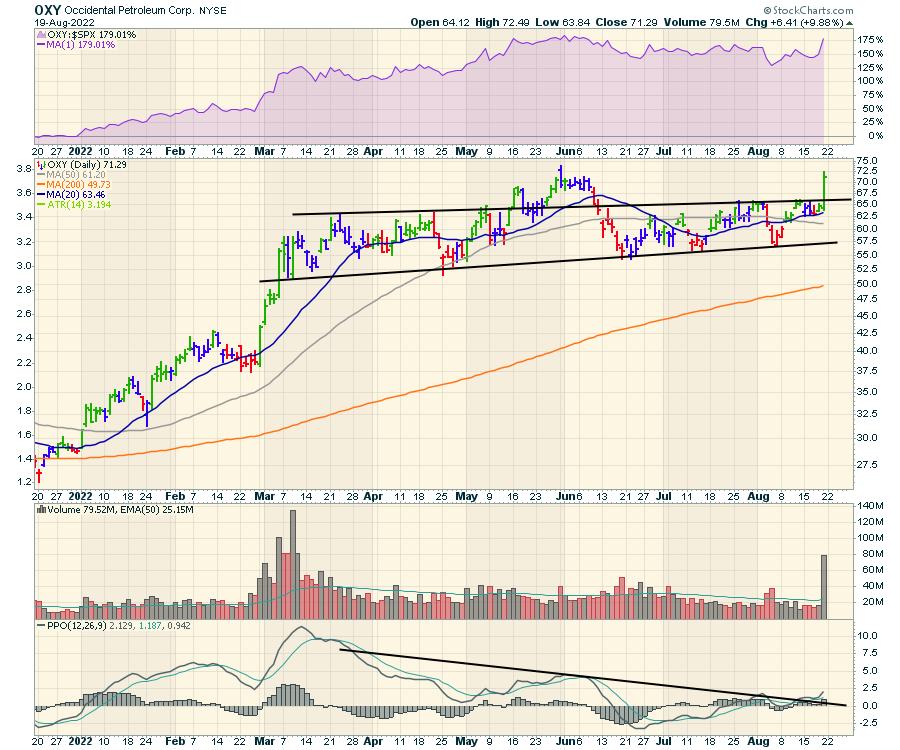
All that to say, this is a good time to be watching these trades closely.
If you are interested in trading through the worldwide energy crisis that is upon us, try a trial subscription for $7 at OspreyStrategic.org. We have been featuring ideas over the last two months, highlighting both renewable as well as Oil and Gas. Renewables have been one of the biggest gainers since the June lows.
Good trading,
Greg Schnell, CMT, MFTA
Senior Technical Analyst, StockCharts.com
Author, Stock Charts For Dummies
Want to stay on top of the market's latest intermarket signals?
– Follow @SchnellInvestor on Twitter
– Connect with Greg on LinkedIn
– Subscribe to The Canadian Technician
– Email at info@gregschnell.com


