The StockCharts Technical Ranking (SCTR) system is a way of finding stocks that are outperforming their peers. This week, I noticed that most of the big names have their SCTR surging into the top quadrant.
SCTR
StockCharts created the SCTR indicator to help find top-performing stocks. It is also a way of seeing how strong a stock is compared to its peer group. The beautiful part is that you can look back at periods of outperformance by a stock, and see how it did relative to peers. Just because a stock is moving up, doesn't mean it is outperforming. If every stock is moving up (summer 2020), which ones were moving up faster, with bigger percentage gains each week?
The top quadrant represents the stocks with the best price action. They are performing better than 75% of their peer group of stocks. When we say performing better, the percentage move is bigger over the same time periods used in the calculation. I have placed a line at 75% and plotted the SCTR at the top of the charts for you to quickly refer to it. Notice the history of the SCTR, as it shows periods of outperformance and underperformance by a stock.
I will use the SCTR to talk about the stock price action relative to its peer group. This is an important distinction. We need to outperform the other peers to outperform the market.
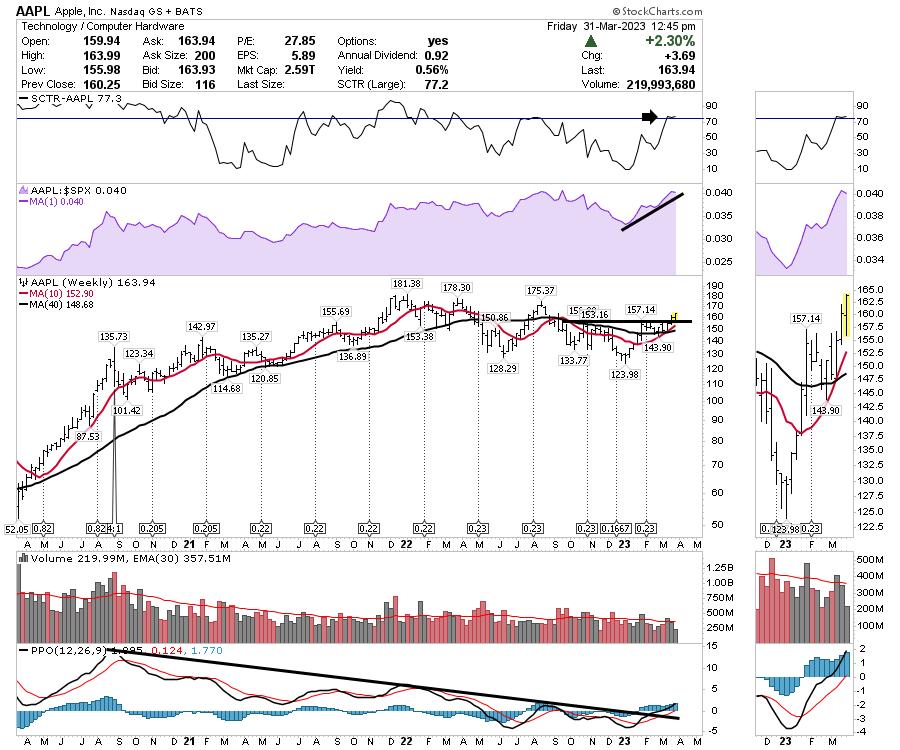
Apple (AAPL)
Apple is breaking out of a base that it has built over the last 9 months. The SCTR is jumping from 30 to 77. The PPO measures momentum and is moving above zero. I like this chart action.
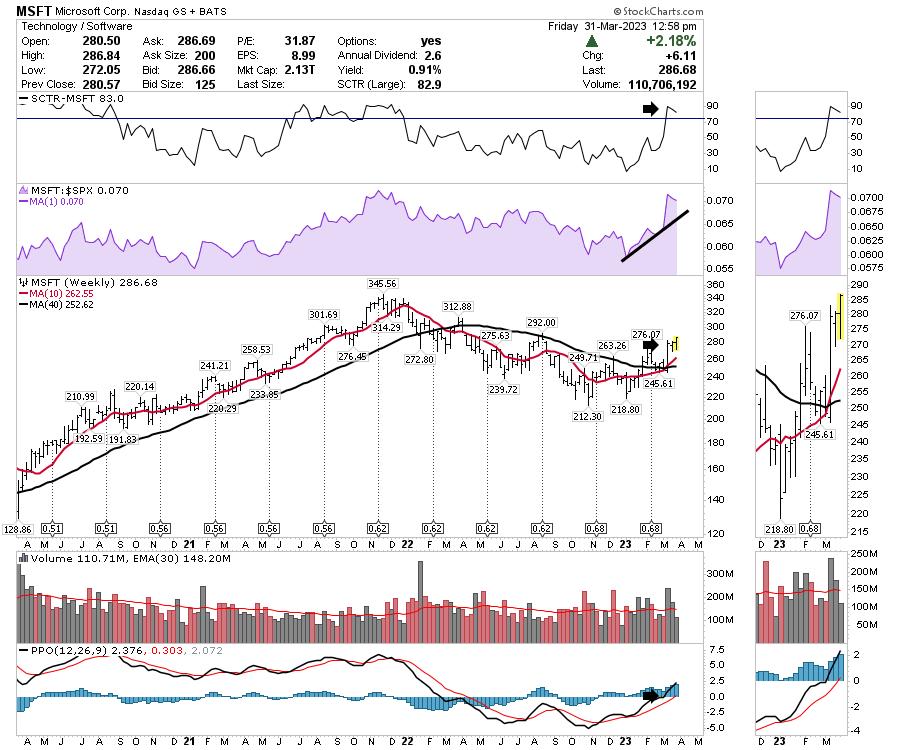
Microsoft (MSFT)
Microsoft is breaking out to a higher high. The SCTR is surging from 30 to 83. Looking left on the SCTR, we can see the chart has another period where the SCTR stayed in the top zone for 6 months and the chart accelerated nicely.
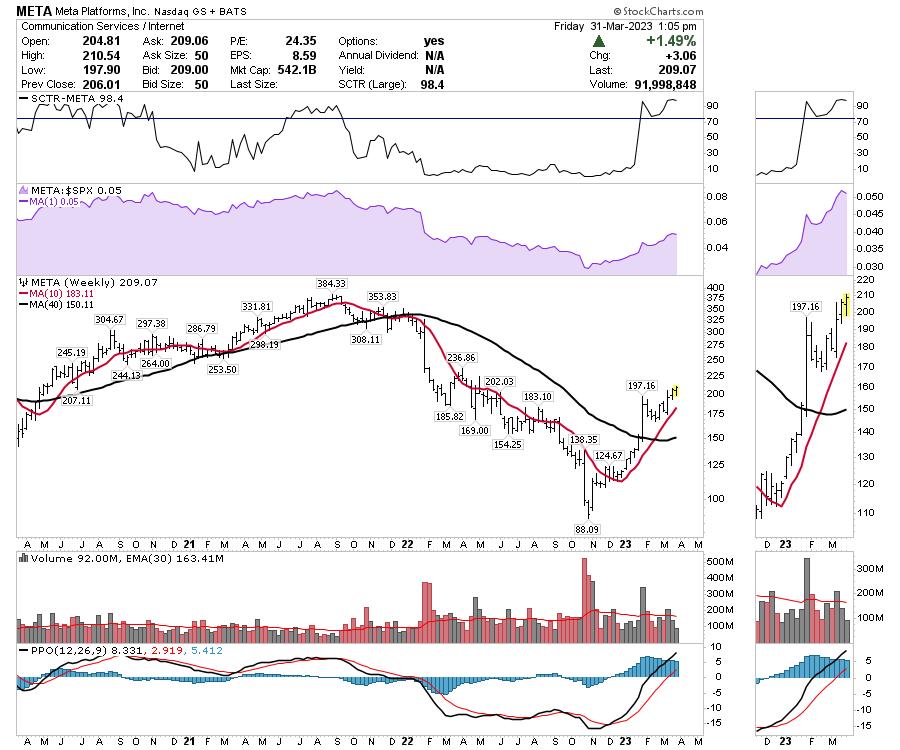
Meta Platforms (META)
I notice that META was one of the worst charts out there in 2022. The SCTR stayed low for most of 2022. I like to watch for very weak charts that finally start to improve relative to their past. Below, just look at the SCTR going from worst to 98% in just a few months.
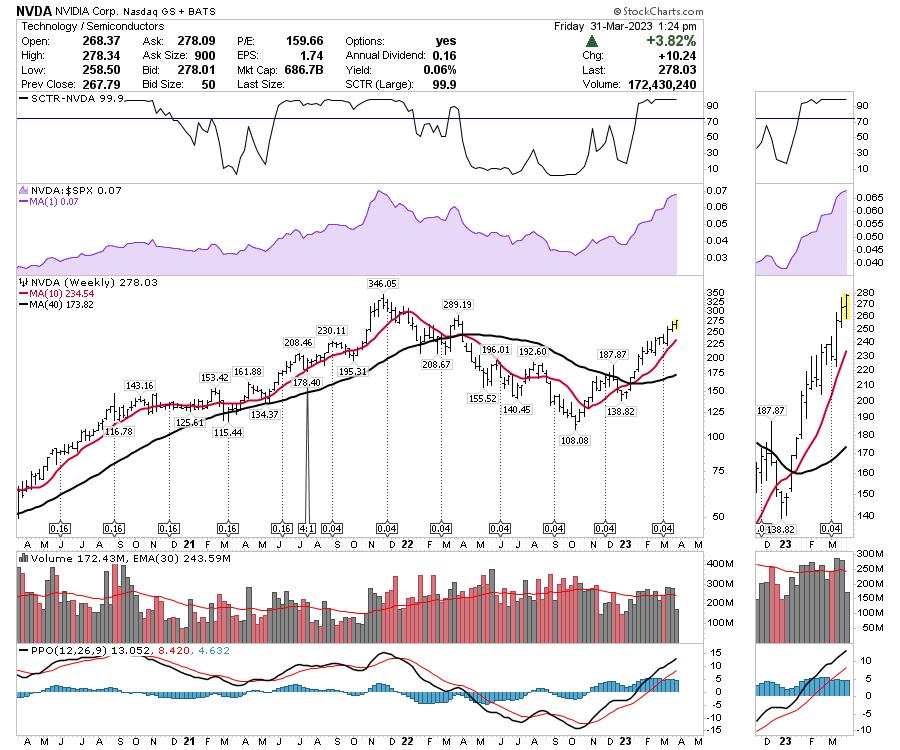
Nvidia (NVDA)
Nvidia is another great example of a weak chart leaving the base and soaring. Back in October, NVDA bottomed out. Price surged higher, and the SCTR did too. NVDA pulled back, and the SCTR came back to a really low level (January 2023), only to go on another massive run. This initial surge, followed by a pullback, can be a nice clue of a stock's potential to break out again.
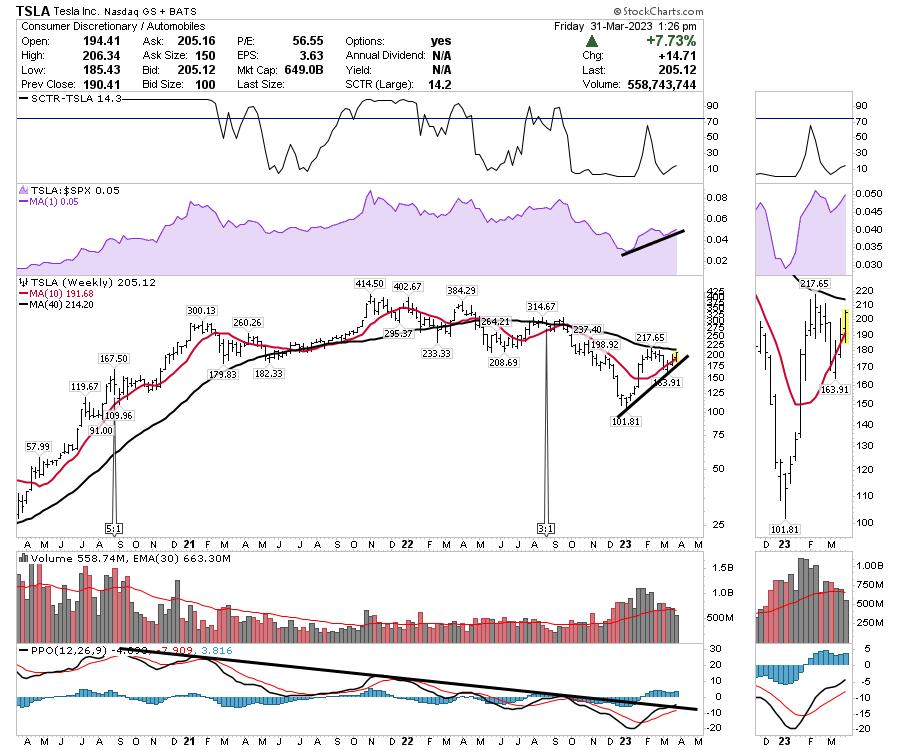
Tesla (TSLA)
Tesla does not have a strong SCTR ranking. However, in the January jump, Tesla moved almost 100%. Recently, it gave some of that back, as you can see on the price chart. The SCTR got extremely weak again. This reminds me of the same setup we saw for Nvidia, just delayed.
Can Tesla surge again? It's worth being ready when you have a large cap that can sport this much change in a short period of time. Tesla has been consolidating for a while, but is setting up to pop above the 40-WMA. The chart setup is eerily similar to some of the other large-cap winners before they made big moves. Can Tesla restart the launch?
There is lots more to watch. We have a really interesting backdrop with all the changes in the economy. Do you have a method of monitoring the background situation? At Osprey Strategic, we do.
If you are interested in the ways we monitor the market, I'd encourage you to go to ospreystrategic.com and try our $7 trial offer. Our focus is capital protection and making money when the market turns higher.
Good trading,
Greg Schnell, CMT, MFTA
Senior Technical Analyst, StockCharts.com
Author, Stock Charts For Dummies
Want to stay on top of the market's latest intermarket signals?
– Follow @SchnellInvestor on Twitter
– Connect with Greg on LinkedIn
– Subscribe to The Canadian Technician
– Email at info@gregschnell.com


