In terms of gauging the current substantial rally, we should look at the relative performance of the "growth" and "value" components thereof. In effect, if we are bullish, then we want to be long that which is outperforming. This is fairly simple.
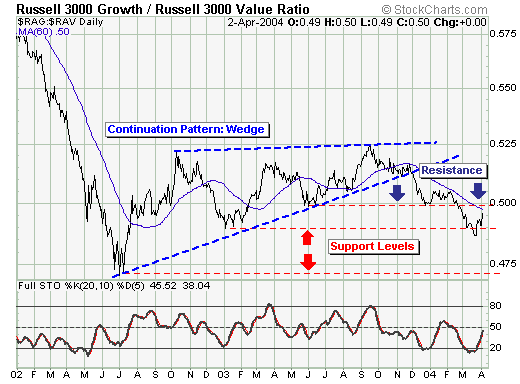
Thus, when we look at the Russell 300 "Growth vs. Value" Ratio - we find the longer-term pattern is a confirmed "bearish wedge" continuation pattern, which augurs for lower lows than that seen during June/July 2002. However, a good short-term level in which to become sellers or buyers happens to be the 60-day moving average. In fact, Friday's sharp rally in the growth stocks has taken prices right back to this now important resistance level. If prices break above it - then one obviously wants to be long growth stocks over the next several weeks. But, if resistance proves its merit...then growth stocks will lag, and one could reasonably become short selected growth shares. In any event - any growth rally will be short-lived given the bearish wedge interpretation...which should translate into lower equity prices overall.