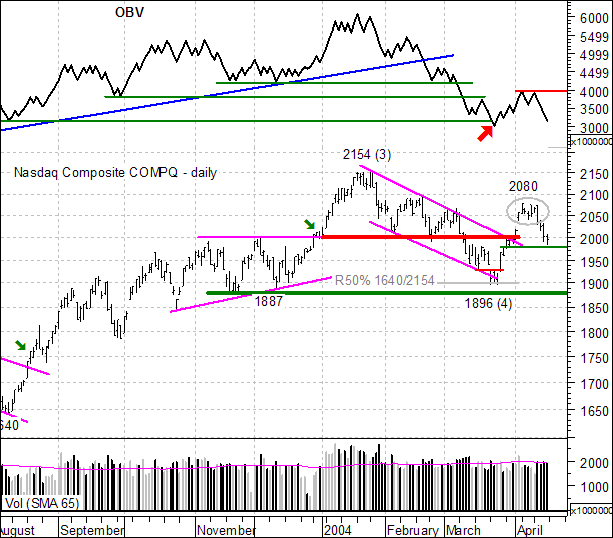
On Monday we were focused on the pennant consolidation with support at 2038 and resistance at 2080 (gray oval). While these are typically bullish continuation patterns and an upside breakout was expected, it was prudent to wait for confirmation. Instead of the expected, the break came to the downside and the index has moved into corrective mode. A 50-62% retracement of the prior advance (1896 to 2080) would extend to the 1970-1990 area and broken resistance turns into support around 2000. A move below 1970 would be more than just a normal correction and suggest that a bigger decline may be ahead.

On Balance Volume (OBV) was developed by Joe Granville in the 70's and is as simple as it gets. Volume is added on up days and subtracted on down days. The concern here is the relatively high volume on down days and the relatively low volume on up days over the last few months. With the decline from late January to late March, OBV moved below its December, September and August lows (red arrow) as selling pressure intensified significantly. The late March/early April bounce is a start, but it would take a move above the early April high to get OBV back on the bullish track.
This was an excerpt from the TDT Report, published every Friday. The remainder includes a primer on measuring relative strength, an application of relative strength to the HealthCare SPDR (XLV), a look at gold/XAU with the US Dollar Index, Elliott Waves applied to the S&P 500 and a Model Portfolio update.


