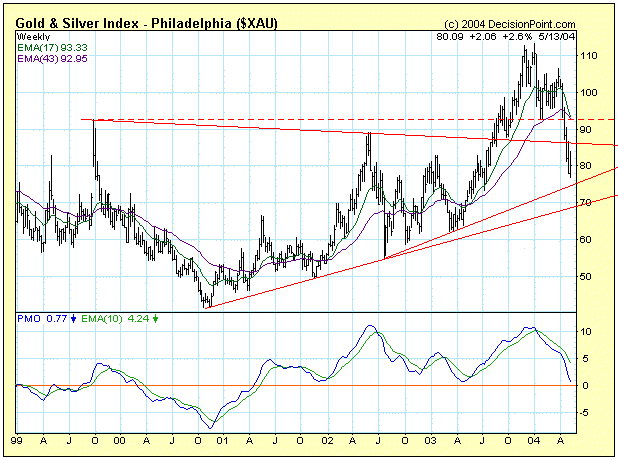
At the end of April the XAU monthly Price Momentum Oscillator (PMO) -- not shown here -- topped at very overbought levels, rendering a long-term sell signal. This action confirmed the sell signal top on the weekly PMO a month earlier, shown on the chart above. Both the monthly and weekly PMO can issue long-term signals, but the monthly PMO is much more serious.
Nevertheless, the weekly PMO shows that the longer-term overbought condition has been relieved, and the daily PMO (not shown) is becoming overbought, so we should be looking for a bounce from around the rising trend line support at 75 or 70. I think it will probably be a strong rally, and may even turn the monthly and weekly PMOs back up, but, in my opinion, sentiment is not yet as bad as it ought to be in order for gold stocks to put in a bottom. I base this opinion upon Rydex Precious Metals Fund net cash flow, which still doesn't reflect the degree of capitulation that we ought to see, considering how badly prices have been hit.
Rather than trying to catch a falling knife, I think that waiting for the weekly PMO to bottom (on a weekly closing basis) will provide a margin of safety for those wanting to trade the next rally.
To learn more about Decision Point's PMO click here.


