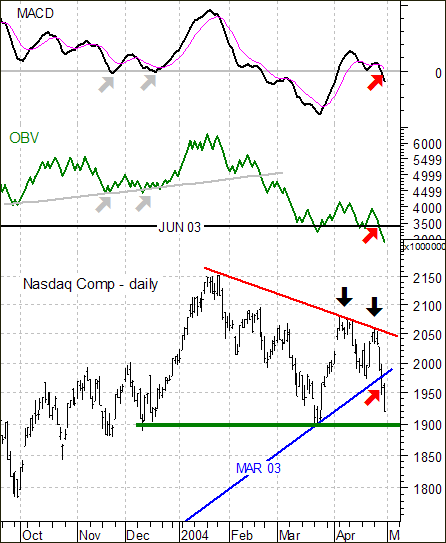
There are three ingredients to a downtrend: lower high, lower low and trendline break. The final ingredient (trendline break) is open for debate, but the lower low and lower high are not. With this week's failure to hold the big gains above 2030 (22-Apr) and break below the 1978, the Nasdaq is well on its way to a trend change. The index formed another lower high below 2100 (black arrows) and broke below the trendline extending up from March 2003. Two of the three ingredients for a trend change are in place and a move below the March low (1898) would solidify the reversal.
In addition to the actual price chart, key indicators confirm recent weakness and point to further downside. MACD moved below its signal line and into negative territory. This bearish signal is confirmed by On Balance Volume (OBV), which moved to an 11-month low (red arrows). These indicators are not correlated and this makes confirmation all the more significant. Notice that MACD moved into negative territory in November and December, but this was not confirmed by On Balance Volume (OBV), which held above its prior lows and continued higher (gray arrows).
This was an excerpt from the weekly TDT Report. The remainder is reserved for subscribers and includes a look at sector weightings within the S&P 500, analysis of the top six sectors (SPDRs), identification of the two biggest culprits, analysis of the S&P 500 and the weekly Model Portfolio.


