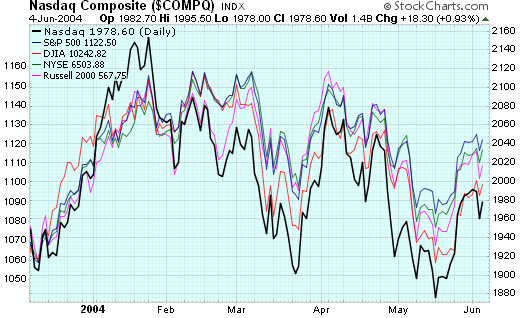
Last week saw the major markets put in another "lower high" for the current downtrend - the third major one since things started moving lower back in March. This three-point downtrend is easiest to see on the Nasdaq's chart, but it appears on most of the other major charts to one degree or another. Here's a new "behind" chart (discussed in our last newsletter) that shows the three-peak downturn for the majors:
Later in this issue, John Murphy looks at Energy stocks, Carl discusses NYSE Member Buying, Arthur Hill is bullish based on Elliott while his friend Richard Rhodes expects a pull-back.
MORE SHARPCHARTS2 TIPS AND TRICKS
Let's look at a long-term chart of the S&P 500 using some of the new tools that are available to us via the SharpCharts2 Beta workbench. Here's a weekly chart of the index going back to mid-2002:
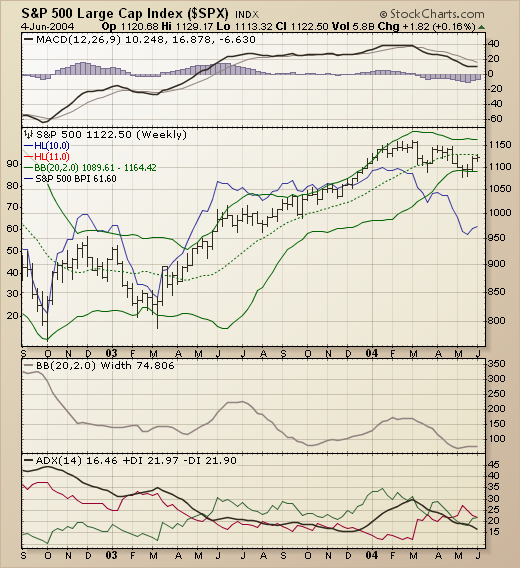
Above the chart is a standard MACD display showing that the weekly MACD histogram went negative back in March for the first time since late 2002.
"Behind" the price bars (in blue) is the S&P 500 Bullish Percent index ($BPSPX) - a market indicator based on the P&F charts of all of the stocks that make up that index. Notice how it's movements "mimic" the movements on the prices bars up until February, 2004? Since then, it has moved lower while the index has moved sideways. This kind of bearish divergence hints at hidden weakness inside the index that is being masked by strength in a small number of components.
On top of the price bars is a standard Bollinger Band display and, below the chart, is the BBand Width display. Notice that the BBWidth is at its lowest point on the chart right now. That means that the index has been moving "sideways" (relatively speaking) for quite some time now. This is also confirmed by the low ADX reading. Also notice that the red "-DI" line (indicating a downtrend) moved above the green "+DI" line for the first time in a year at the start of May.
All-in-all, a picture of weakness for the S&P 500 and a great example of the kind of composite charts that our new SharpCharts2 workbench can deliver.


