The Rydex Asset Ratio has been around for eight or ten years, and it is a favorite among sentiment indicators because it is based, not upon opinion polls, but upon where people are actually putting their money. It is calculated by dividing total assets in bear index and money market funds by the total assets in bull index and sector funds.
Recently Decision Point introduced the Rydex Cash Flow Ratio. It uses the same basic formula, but, instead of total assets, it uses Cumulative Cash Flow (CCFL) totals for the same funds. To determine CCFL we calculate daily net cash flow, which is the actual cash entering and leaving each fund in the Rydex group of funds. This is done by calculating the amount that total assets in a fund should have changed based upon the percentage change of the net asset value (NAV) per share, assuming that no cash was added to or taken out of the fund. We then subtract this amount from the actual amount of total assets in the fund, and the result is the daily net cash flow. We keep a cumulative total of the daily net cash flow. Total asset value tells us how much money is in the fund. Cumulative Cash Flow tells us how much cash was actually moved in or out of the fund.
We think that the Rydex Cash Flow Ratio is a dramatic improvement over the Rydex Asset Ratio, because it uses an estimate of the amount of money that has been committed to bull and bear funds, making it a more accurate reflection of the actual underlying psychological forces that are affecting market participants.
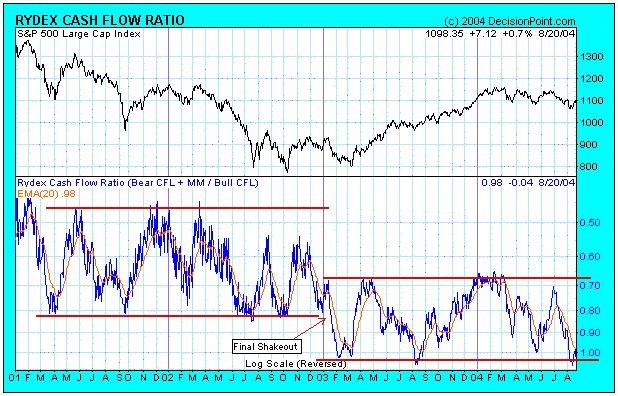
On the chart below we can see that the Cash Flow Ratio shows more rational and consistent levels of support and resistance. And we can see that the Cash Flow Ratio is able to maintain a fairly well-defined trading range for extended periods.
It is really striking how the Cash Flow Ratio has clearly detected the true state of sentiment during 2002 through 2004. For example, we can see a sharp rise in bullish sentiment coming off the March 2003 price lows. Then by May 2003 we can see sentiment peak and begin to turn bearish. I remember because I was there. People didn't believe that a bull market had begun. They became progressively more bearish in June and July, and, when the market had a small shakeout in August 2003, the Cash Flow Ratio was as bearish as it had been in March 2003. While that may not seem reasonable based upon price movement, I think it is an accurate expression of how sentiment "felt" at the time.
Also, note how the Ratio trading range shifts downward at the beginning of 2003. This was caused by a large chunk of money moving into bear funds as the market headed down into it's final low before the bull market launched. Bearishness reached a feverish pitch at that time and it permanently altered the trading range. This could happen again in either direction if sentiment is strong enough.
Finally, we can see that the recent levels of bearishness at the August 2004 price lows are the same as they were in March and August 2003. In my opinion, this is strong evidence that a medium-term price low was reached at that point.


