WHY WE USE MOVING AVERAGES ... You've probably noticed that I rely very heavily on moving average lines. There are some good reasons for that. The main one is that they are one of the simplest ways to spot trend changes. But not all moving averages are equal. The 50-day moving average, for example, is most useful in spotting "intermediate" trend changes which can last anywhere from one to three months. A 20-day moving average is better for spotting "short-term" trend changes which can last for days or weeks. The 200-day average helps determine the direction of the "long-term" trend of a market, which can last for months and even years. Of the three, the 200-day average carries the most weight. For timing purposes, however, the 20- and 50-day lines are more useful. My favorite is the 50-day line. While a crossing of the 20-day line gives an earlier trend signal, the crossing of the 50-day line suggests that the trend has more staying power. This is true for the timing of entry and exit points. Buy signals are given when the price crosses over a moving average line. In that sense, upside moving average crossings are good for buying purposes. Crossings below the moving average lines can be used for selling purposes. They're not perfect, but they are very helpful. Moving averages also provide good discipline. A simple rule to sell a stock that closes under its 50-day moving average can prevent a lot of losses.
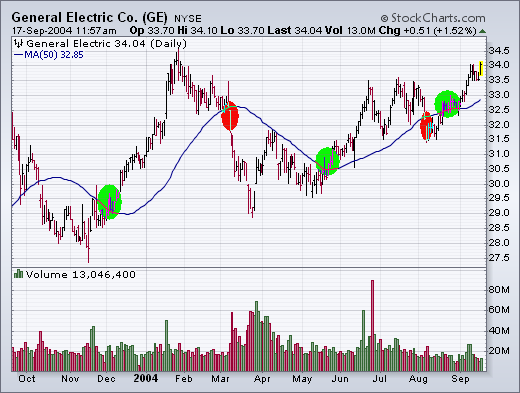
USING THE 50-DAY AVERAGE ON GE... The next chart shows why I find the 50-day most useful. Since we're following GE today, let's compare the daily price of GE to its 50-day average for the last year. The blue line is the 50-day average. [That's computed by adding up the closes for the last 50 trading days and dividing the total by 50]. Buy signals are given when the price closes over the blue line (see green circles); sell signals are given when the stock closes below the blue line (see red circles). The first two buy signals were given last December and May. In both cases, the stock rose after that. The first sell signal was given during March. The stock fell heavily after that. [The signals don't always work out that well, but they did in the case of GE]. Let's examine the last two signals more closely and bring the 200-day average into play for GE.
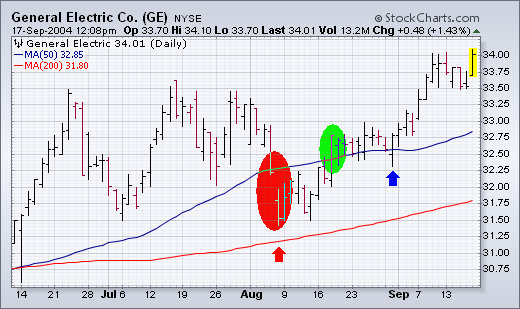
COMBING MOVING AVERAGE LINES... The next chart examines the last two GE moving average "signals" and also shows why it's important to keep an eye on the 200-day average. GE gapped under its blue 50-day average in early August (see red circle). As it turns out, that wasn't a great signal. Notice, however, that GE stabilized above its (red) 200-day average (see red arrow). That suggested that the "long-term" trend was still up. Within two weeks of issuing a "sell" signal, GE crossed back over its 50-day line to issue a new "buy" signal. That signal is still in effect. Notice that GE never closed back under its 50-day line after issuing a buy signal. That's another test of a moving average signal. Once a market closes above a moving average, that line becomes a support level. If it closes under the moving average, the signal becomes suspect. The blue arrow in late August shows the stock dipping under the blue line "intra-day" before closing higher. Intra-day moves don't count. Only the "closes" matter. This example shows the strength and weakness of moving averages. They may cause occasional "whipsaws", but they help keep us on the right side of the market. That's why we use them and why I call your attention to markets that cross their 50- and 200-day averages. It's a simple way to alert you to potential trend changes. You can then examine the market more closely using other charting tools. For weekly charting, the 10-week average replaces the 50-day, and the 40-week replaces the 200-day.