Last time we talked (on October 2nd) there was reason for optimism with the Dow. Oh, how times have changed...
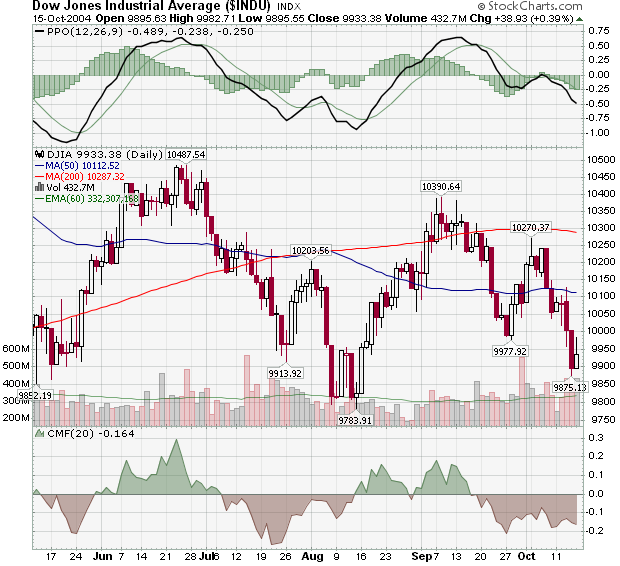
Unfortunately for the bulls, the promising uptrend that was created by the trough at 9,977 didn't fully materialize. After flirting with the red 200-day MA line around 10,390, the index retreated back below 10,000. Friday's 39 point gain probably won't hold up as the market really needs to test the August low (9783) before it can start another strong rally.
The other important development on this chart has to do with the 200-day MA. Can you spot it?
The 200-day MA is now moving lower for the first time in quite a while. In fact, you have to go back to April 2003 to find the last time the Dow's 200-day MA was moving lower. This is a very bearish development and means that everyone's default position on stocks should be bearish.
This week's issue is jam-packed with charts and commentary starting with my look at John Murphy's 9th Law of Technical Trading. John follows that with the key reasons for the recent market weakness. Richard Rhodes looks at the Large Cap/Small Cap ratio, Carl looks at the Large Cap/Volatility Ratio, and Arthur Hill (who has a great article is this month's Stocks & Commodities magazine) looks at the long-term Nasdaq chart. You'll want to see why he ends his article with the word "Gulp"...
LAW #9: TREND OR NOT A TREND
Law #9: Use ADX. The Average Directional Movement Index (ADX) line helps determine whether a market is in a trending or a trading phase. It measures the degree of trend or direction in the market. A rising ADX line suggests the presence of a strong trend. A falling ADX line suggests the presence of a trading market and the absence of a trend. A rising ADX line favors moving averages; a falling ADX favors oscillators. By plotting the direction of the ADX line, the trader is able to determine which trading style and which set of indicators are most suitable for the current market environment.
As we saw with the Dow Jones chart in the last issue, determining when a new trend has started is difficult at best. If only there was a way to see how "strongly" a stock is trending. Well, that's exactly what the ADX line does! Check it out:
![http://stockcharts.com/h-sc/ui?c=$INDU,uu[h,a]waclyyay[df][pb10!b40][vc60][iUl14]](https://d.stockcharts.com/img/articles/2004/10/6a0105370026df970c0105371e8b0c970b-pi)
Here's a longer-term, weekly Dow chart. The blue vertical lines show where the Red and Green +DI and -DI lines cross inside of the ADX indicator window. Ignoring some lag -which is common with a 14-week indicator like this - you can see that those blue lines divide the chart into a downtrending period, an uptrending period, and a mixed period (from April onwards). The best example of using the black ADX line that John was talking about can be seen during the downtrend period (from April 2002 to May 2003).
Initially, the ADX line is quite low as the new downtrend gets established. By July 2002, it is rising quite quickly meaning that the downtrend is strengthening. This is the time when, according to John, you should favor moving averages for trading signals.
The downtrend bottoms out in early October, just as the ADX hits its peak. The ADX then begins a slow decline that lasts until May 2003. That is the period on the chart during which John says you should favor Oscillators for trading signals.
More Info:
The ADX was developed by Welles Wilder as part of his "Directional Movement Index (DMI)" system. It was first described in his book New Concepts in Technical Trading back in 1978.
Note: John's entire 10 Laws of Technical Trading can be found in our "ChartSchool" area under "Trading Strategies". If you missed any of my previous articles on Murphy's Laws, the ChartWatchers Archives page will take you to any of them.


