There's some good news on the Dow chart this week. Despite Thursday's Merck-induced dip, the index moved higher on Friday and solidified last Tuesday's reversal at the 9977 level. That reversal was very significant as it was the first step in establishing a new uptrend for the index. Check out the chart below to see what I mean:
.
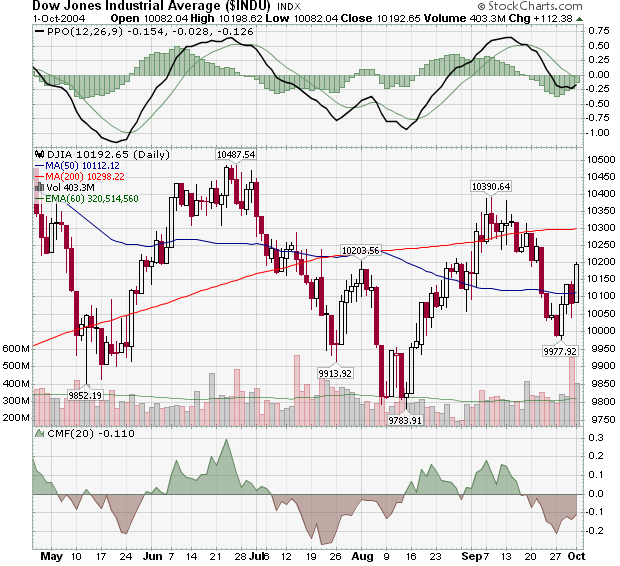
The turn at 9977 was much higher than the previous reversal back in August at 9783. While that's a very bullish sign, cautious ChartWatchers might want to wait for confirmation before getting too excited. Classical peak-and-trough analysis says that confirmation will happen when/if the index moves about the previous peak at 10390.
Why be cautious right now? Well, we only have to look back to the short-lived uptrend in late July for the answer. July's low of 9913 was higher than the previous low (the 9852 from mid May), but confirmation didn't happen and the index moved even lower by mid-August.
Still, with the 50-day MA starting to move higher and the PPO and CMF turning up, things look positive for the short-term.
Before I get into this week's look at Murphy's next law, I wanted to remind everyone to check out all of the areas of the newsletter including John Murphy's call for Nasdaq leadership and Carl Swenlin's look at the amazing 9-month cycle effect.
LAW #8: KNOW THE WARNING SIGNS
Law #8: Trade MACD. The Moving Average Convergence Divergence (MACD) indicator (developed by Gerald Appel) combines a moving average crossover system with the overbought/oversold elements of an oscillator. A buy signal occurs when the faster line crosses above the slower and both lines are below zero. A sell signal takes place when the faster line crosses below the slower from above the zero line. Weekly signals take precedence over daily signals. An MACD histogram plots the difference between the two lines and gives even earlier warnings of trend changes. It's called a "histogram" because vertical bars are used to show the difference between the two lines on the chart. - John Murphy
Check out this chart of QQQ as you read John's description of Law #8. Above the chart is the standard daily MACD plot that contains the thick MACD line, the thin MACD Signal line and a small version of the MACD Histogram. Behind the QQQ candlesticks is a much larger version of that same daily MACD Histogram. Beneath the chart is the weekly MACD indicator (Just multiply the daily parameters by 5).
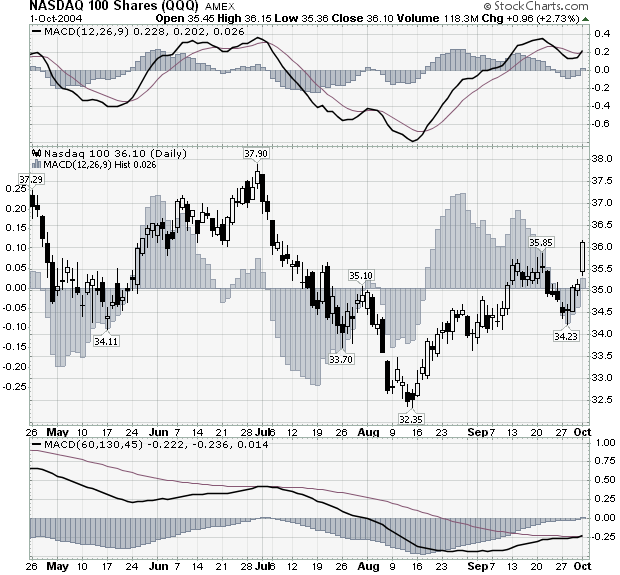
So what do you think? Bullish or bearish? According to Law #8 is now a good time to buy the Q's or short them?
Hopefully, you can see that the Q's look pretty bullish right now from this chart. Not only has the daily MACD lines just had a buy signal - which you can see because the Histogram has just moved back into positive territory - but the weekly MACD has also just given a buy signal - its first one in a long time.
Note: I used the Beta version of our new charting tool - SharpCharts2 - to create this chart. Our older charting tool cannot place indicators "behind" the price plot like I did with the histogram above.
More Info:
In addition to our 4-part ChartSchool article on the MACD, we also have Gerald Appel's book "Winning Market Systems" in our bookstore.
Note: John's entire 10 Laws of Technical Trading can be found in our "ChartSchool" area under "Trading Strategies". If you missed any of my previous articles on Murphy's Laws, the ChartWatchers Archives page will take you to any of them


