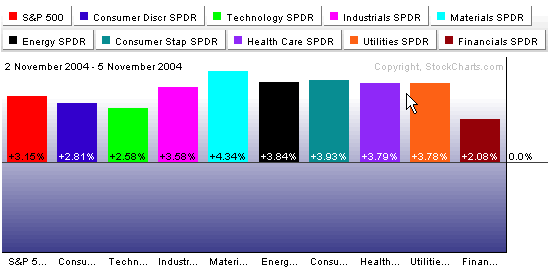
Nothing helps the markets like a lack of uncertainty. With the election resolved quickly, a big relief rally got underway on Wall Street with the Materials, Energy and Consumer Staples sectors posting the biggest gains. Let's go to the charts:
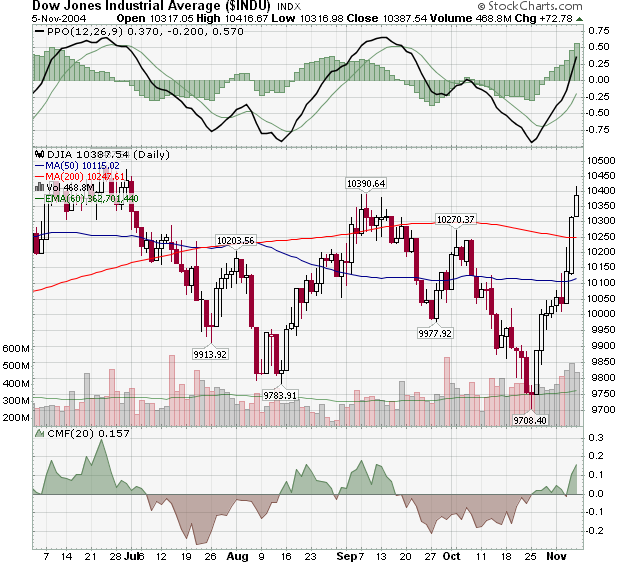
Notice on the daily Dow chart above that Friday saw the index test its next mid-term resistance level - the 10,390 high set back in early September. Assuming that it continues higher next week, what are the Dow's next resistance levels? The answer appears clearly on our weekly Dow chart below:
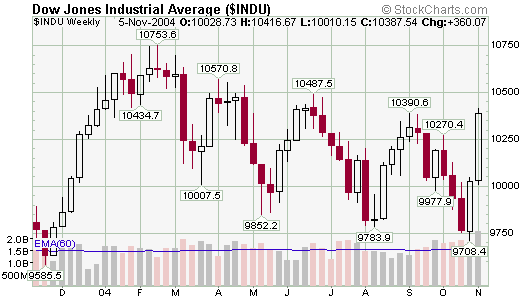
10,487 from mid-June and 10,570 from the beginning of April would be the next goals - but let's not get ahead of ourselves just yet...
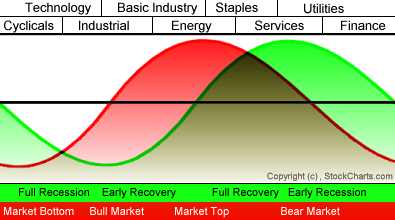
Back to the sector picture, notice that the strongest performing sectors over the past couple of days - Materials (AKA "Basic Industry"), Energy, and Consumer Staples - are positioned near the middle of our Sector Rotation model. That suggests that the current economic cycle is maturing. Confirmation of this possibility would occur if Consumer Staples and Consumer Services take off in the coming months while Technology and Finance continue to lag.
This week brings us to the next-to-last article in my series on John Murphy's 10 Laws of Technical Analysis.
LAW #10: KNOW THE CONFIRMING SIGNS:
Law #10: Include volume and open interest. Volume and open interest are important confirming indicators in futures markets. Volume precedes price. It's important to ensure that heavier volume is taking place in the direction of the prevailing trend. In an uptrend, heavier volume should be seen on up days. Rising open interest confirms that new money is supporting the prevailing trend. Declining open interest is often a warning that the trend is near completion. A solid price uptrend should be accompanied by rising volume and rising open interest. - John Murphy
"Pssst! Hey you! Over here... Have I got a hot stock for you. It's in a hot sounding sector, momentum is moving higher and it's breaking out right now! A savvy investor like yourself shouldn't pass up such a golden opportunity. MDKI - Check it out!"
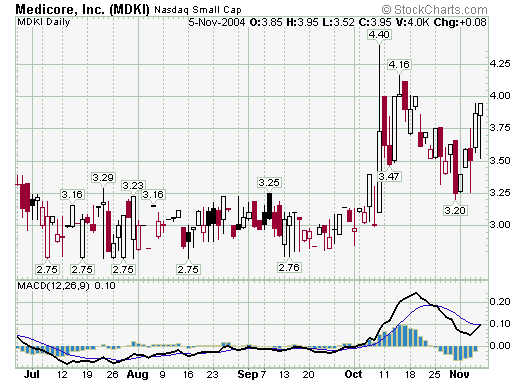
Hopefully everyone reading realizes that I was just kidding above - but let's pretend some more. What's wrong with the above chart? Actually - nothing. MDKI is rallying after bouncing off of 3.20 and has just had a bullish MACD cross-over with the MACD in positive territory - all of those are very positive technical developments. The problem is what is not on this chart - Volume! Let's look at a different chart for this same stock:
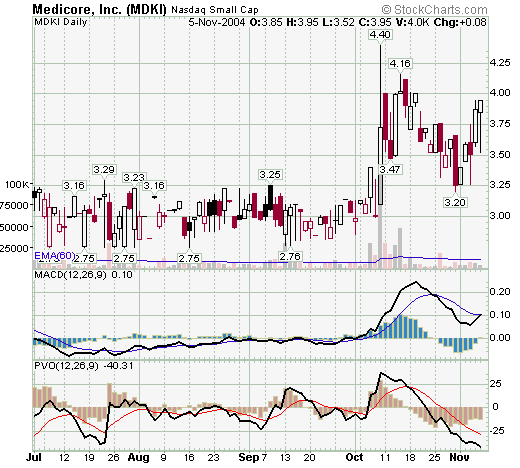
This chart has the volume action overlaid in light red/black histogram bars behind the candlesticks. It also include the Percentage Volume Oscillator (PVO) which is essentially the MACD for volume. Suddenly things don't look so rosy for MDKI. Volume has been declining ever since the big spike up on October 8th. The rally over the past 3 days has occurred on ever lighter volume. In addition, the PVO (which indicates "volume momentum") is low and getting lower. This doesn't bode well for the short term.
Of course, T/A is all about playing the percentages - there's nothing on this chart that guarantees that MDKI will head lower soon, but without the all important confirmation from Volume, the odds are not good.
Side Note: John mentioned "Open Interest" in addition to volume. Open Interest is the number of options or futures contracts that are still unliquidated at the end of a trading day. A rise or fall in open interest shows that money is flowing into or out of a futures contract or option, respectively. In futures markets, rising open interest is considered good for the current trend. Open interest also measures liquidity. Unfortunately, StockCharts.com currently doesn't provide access to Open Interest information yet. Confirmation from volume is the way to go.
Note: John's entire 10 Laws of Technical Trading can be found in our "ChartSchool" area under "Trading Strategies". If you missed any of my previous articles on Murphy's Laws, the ChartWatchers Archives page will take you to any of them.


