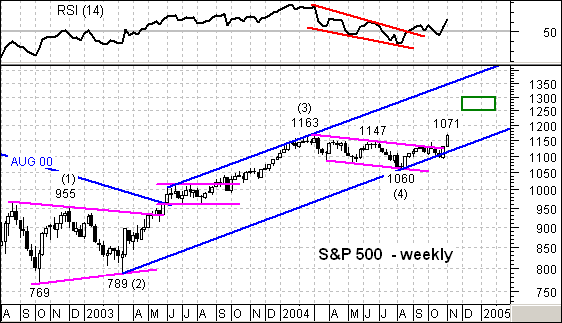
For once, the S&P 500 is stronger than the Nasdaq 100 as the index has already broken above its 2004 high (1163). The overall pattern looks like an Elliott 5-Wave advance and the 2004 decline formed Wave 4. In addition, this decline looks like a falling flag that overstayed its welcome with the August low at 1060.
Regardless of the length of pattern, the breakout above the upper trendline and 2004 high signals a continuation of the Mar-Jan advance. Should the rising price channel remain intact, a move towards the upper trendline can be expected (1350-1400). This seems a bit extreme and a more reasonable target would be around 1250. A Fibonacci 62% of Wave 3 would project a move to around 1300 (1163 – 789 = 374, 374 x .62 = 232, 1060 + 232 = 1292).
For signs of failure, turn to the late October low at 1090. This low was part of the sharp advance in the last week of October. Should the index fail to hold a breakout above 1150 and move below 1090, the 2004 falling price channel (bears) would be back in force.