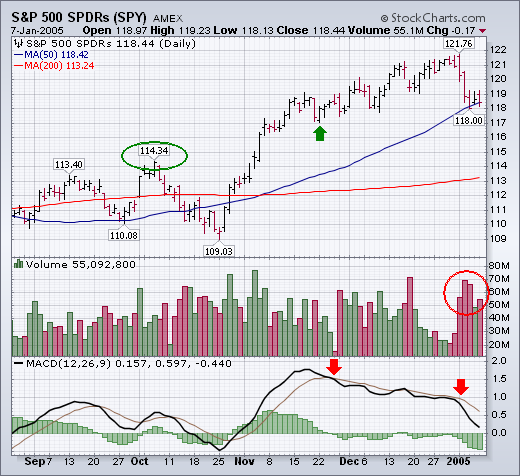
The S&P 500 ended the week with a loss of nearly 30 points (-2.4%). According to the historical record since 1950, a down close during the first week of January by the S&P 500 has resulted in a down year 45% of the time. A loss for the entire month of January raises the percentages for a down year to 58%. The good news is the the S&P 500 SPDRs (SPY) are still trading over their 50-day moving average. The bad news is that the Nasdaq market and the Russell 2000 Small Cap Index closed beneath that support line. Those were the two groups that led the market higher during the second half of 2004. They're now leading it lower. Also of concern is the volume pattern during the week. The biggest (red) volume bars took place during the four days while prices were falling. The smallest (green) volume bar took place on Thursday when the market managed a modest bounce. That means there's a lot more downside volume than upside volume. And that's not a good sign for the market. Daily indicators like the MACD lines have turned negative. [The weekly and monthly lines are still positive, but weakening]. If the S&P cracks its 50-day line, the next support shelf sits at 117 (see green arrow). The most significant support level on the chart is the early October peak near 114 (see green circle). Any close beneath that level would, in my opinion, significantly weaken the long-term picture.