January and 2005 have not been good for the bulls. After a strong finish in 2004, stocks were hit with strong selling pressure to begin the year and have yet to recover. A look into November and December reveals early weakness in two key groups. More importantly, traders can turn to these two key groups for signs of a bullish revival.
So who done it? Look no further than Retail and Semiconductors. The retail group makes up a big part of the Consumer Discretionary sector and influences the S&P 500. In addition, estimates are that retail spending drives 2/3 of GDP and exerts a large influence on the economy. Semiconductors represent a key tech group that influences the Nasdaq, which in turn affects the S&P 500.
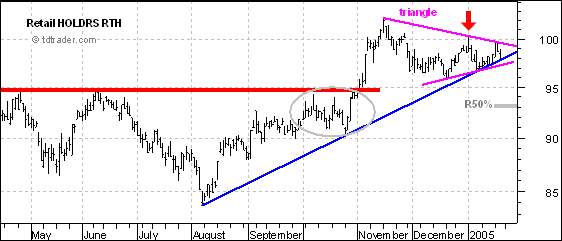
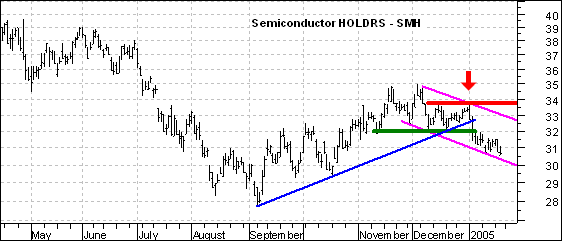
Both stocks were keeping pace until mid November and then started underperforming in December. While the S&P 500 and Nasdaq finished 2004 near their highs for the year, the Retail HOLDRS (RTH) and the Semiconductor HOLDRS (SMH) failed to exceed their November highs (red arrows) and began underperforming.
SMH went on to break the blue trendline and key support at 32 for a bearish signal, while RTH formed a triangle over the last two months. Both need to move above their 3-January highs to put the bulls back in charge. The pattern for SMH looks like a falling price channel (magenta trendlines), but the channel is still falling and it would take a move above key resistance at 33.77 to forge a significant breakout. For RTH, a move above 100.25 would signal a continuation higher. As long as these early January highs hold for both, the broader market is likely to remain under pressure.