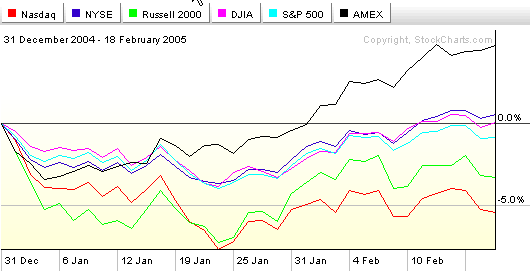
2005 is well underway now and some important technical trends are developing on the year-to-date charts.
As you can see on this PerfChart, since the start of the year, the energy-heavy AMEX index has outperformed the other benchmarks significantly. The Dow, the NYSE, and the Large-Caps are clustered around the break-even point and the small-caps and tech-heavy Nasdaq have both had significant losses so far.
Will these trends continue? And if so, for how long? These are the questions that our commentators try to get a handle on during the rest of this issue. First, John Murphy

About the author:
Chip Anderson is the founder and president of StockCharts.com.
He founded the company after working as a Windows developer and corporate consultant at Microsoft from 1987 to 1997.
Since 1999, Chip has guided the growth and development of StockCharts.com into a trusted financial enterprise and highly-valued resource in the industry.
In this blog, Chip shares his tips and tricks on how to maximize the tools and resources available at StockCharts.com, and provides updates about new features or additions to the site.
Learn More


