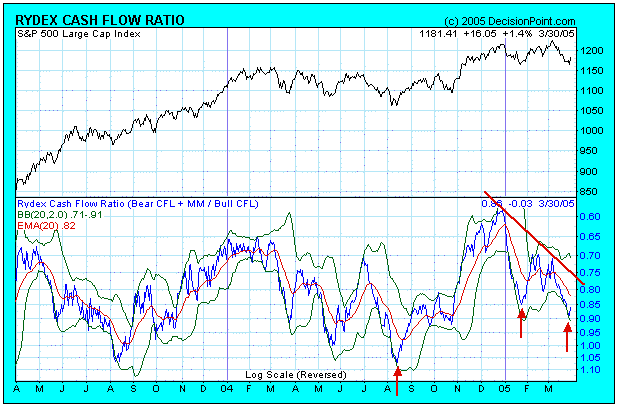
The Rydex Asset Ratio measures the amount of bullish and bearish sentiment by tracking and comparing the total assets in Rydex bull and bear funds. Decision Point also calculates the Rydex Cash Flow Ratio, an indicator we developed that accounts for the actual cash flowing into and out of the funds by canceling the effect of changing share prices on total assets.
On the chart below we can see that bulls were not nearly committed at the March price top as they were at the December 2004 top. I have drawn a line across the corresponding Ratio tops to illustrate the negative divergence.
The two Ratio lows in January and March represent short-term oversold points, but the real benchmark is set by the Ratio lows in August 2003 and August 2004. When this level is reached again, it will probably mark an intermediate-term price low.
The Ratio has maintained a pretty steady range for the last two years, but it could shift higher or lower based upon the longer-term trend of prices.

