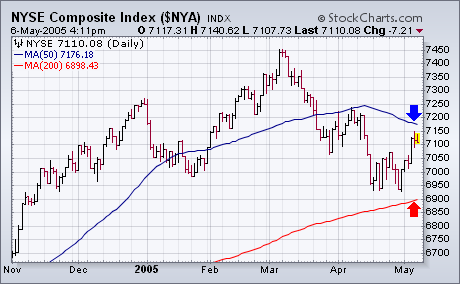
Every time I write about a certain stock market index, I'm asked why I don't write about some of the others. I generally try to spread my coverage around to all the major stock indexes, but can't cover them all at once. I also try to find the one that's giving the truest read on the overall market. Yesterday, for example, I used the S&P 500 for an in-depth market view and came up with a mixed picture. If I had chosen the Nasdaq, I would have a gotten more negative reading. If I had chosen the NYSE Composite Index , I would have come up with a slightly more positive read. Chart 1 shows part of the reason why. The NYSE is the only one of the major market indexes that stayed over its 200-day moving average in late April. Considering that most of those indexes are now back above their 200-day lines, I'd have to say that the NYSE may have given the most reliable reading. I decided to focus on the NYSE today and to re-introduce some point & figure charts. I'm going to revisit the Bullish Percent Indexes on the major market averages which also utilize point and figure charts.