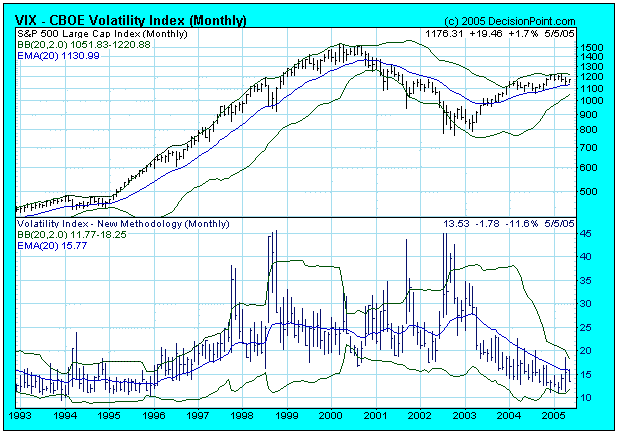
The CBOE Volatility Index (VIX) is a measure of the implied volatility of SPX index options. (According to the CBOE web site, "volatility is a measure of the fluctuation in the market price of the underlying security.") As a practical matter, the VIX measures the amount of fear that options writers have about the future volatility of the market, and, as with any sentiment gage, it is based upon current market action.
While the VIX is most commonly used for short-term analysis, it is also useful to interpret it in a longer-term historical context. I have done this before, but an interview with Larry McMillan in the May 2005 issue of Active Trader magazine prompted me to revisit the topic.
One of he arguments being used to support a bearish case for the market is that the VIX readings have been very low, but as you can see, this is not always the case. While low VIX readings may reflect complacency, they do not necessarily mean that the market is going to decline. For example, an extended period of low volatility preceded the 1995-2000 bull market up leg.
John Bollinger has made the point that low volatility usually precedes a period of high volatility, much like the calm before a storm, but it does not predict if the coming period of high volatility will be associated with price advance or price decline.
Conversely, while we can clearly see that there are high spikes on the VIX at the bottom of market corrections, higher VIX readings are also possible during market advances.
The bottom line is that you should look at historical charts to verify bullish or bearish assertions based upon a particular indicator. There may be an extended market decline in our immediate future, but the currently low VIX reading does not provide any proof to the argument.

