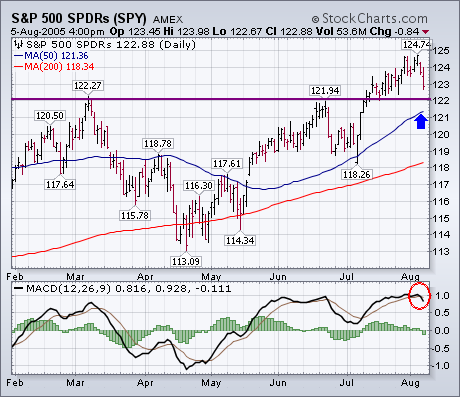
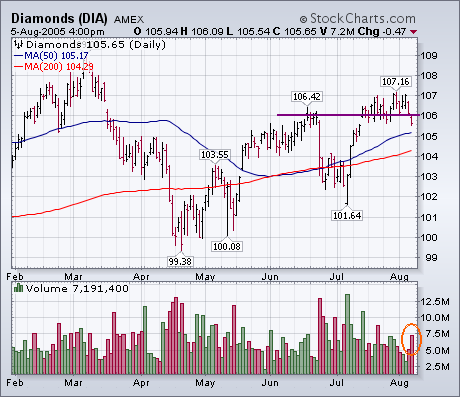
The market's short-term picture continues to weaken. Yesterday I wrote about the MACD lines for the S&P 500 being on the verge of turning negative. They did that today for the S&P and several other major market averages. That signals the start of a short- to intermediate-term correction. For the S&P 500 SPDRs (Chart 1), the first significant test of support will come around the 122 level. Two peaks were formed around that level (March and June) prior to July's upside breakout. On pullbacks, an index is supposed to find support along old breakout points. Another potential support level is the rising 50-day moving average. The market's overbought condition, combined with the fact that August is usually a weak month, is enough to raise the market's risk level for the balance of the summer. Chart 2 shows the Dow Diamonds falling back below their June high at 105 on rising volume. That's another caution flag.