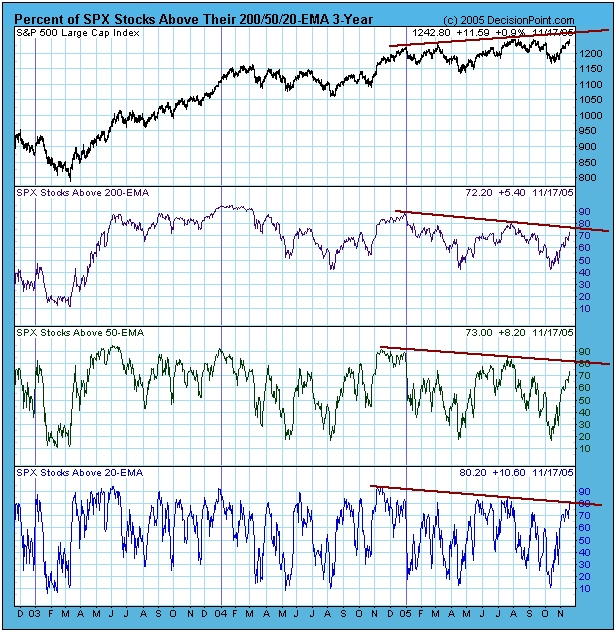
When a stock is above a moving average it is considered bullish, and the stock can be considered to be in a rising trend for that time frame. A good way to determine the market's overall condition (overbought/oversold) across a range of time frames is to analyze the percentage of stocks above their 20-, 50-, and 200-day moving averages. The following chart shows the condition of the stocks in the S&P 500 Index.
As you can see the market is becoming overbought in all time frames. Each of the three indicators is not only approaching the top of its trading range, but they are very close to the declining tops lines I have drawn, which demonstrates how participation is fading even as the S&P 500 moves to progressively higher tops. If the indicators can press higher to about the 90% level, it would be a longer-term positive; however, if the declining tops lines prevail, it is likely that overhead resistance on the price index will force another correction.
I am seeing this kind of picture through a wide range of internal indicators, and investor sentiment is becoming extremely bullish, so I expect that there will soon be another correction of sufficient depth and duration to clear the overbought condition and dampen confidence. As you can see from other corrections in the last few years, this can be accomplished fairly quickly and painlessly.


