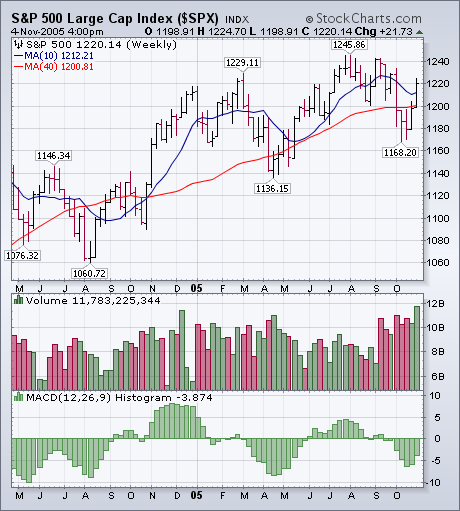
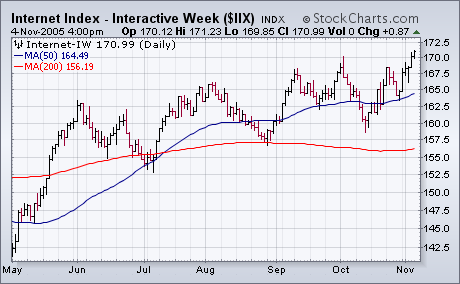
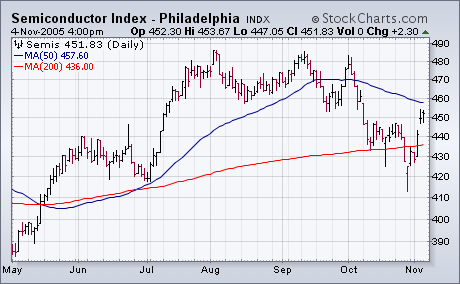
The weekly bars in Chart 1 show the improvement in the S&P 500 this past week. Not only did it close back over its (red) 40-week average, but it closed above its (blue) 10-week average as well. Even more impressive was the heavy upside volume. That strong action moved the market out of its danger zone. Having survived the dangerous month of October, the market has now entered a seasonally strong period between now and yearend. The weekly histogram bars are still negative (below the zero line). However, they have risen for two consecutive weeks (meaning the MACD lines are starting to converge). While that doesn't constitute a "major" buy signal, it does suggest the covering of short positions (or lightening up on bear funds). With oil still on the defensive, fourth quarter market leadership is coming from financials, retailers, the transports, and technology. Most of the recent technology leadership came from Internet stocks which closed at a new recovery high (Chart 2), while semiconductors have been one of the market's weakest groups. This week, however, the SOX Index climbed back over its 200-day moving average (Chart 3). It's a good sign when even the weakest groups start to show some improvement.


