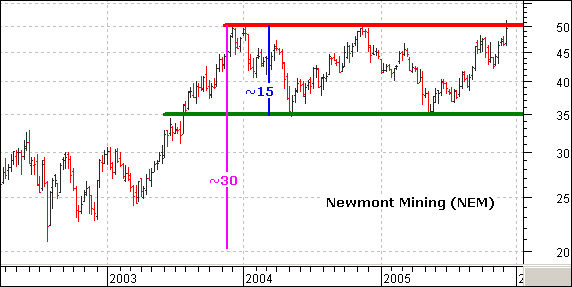
Since NEM first broke above 35, gold has advanced from below 400 to above 500. However, NEM remains stuck in a long-term trading range. Did NEM secretly hedge production? Probably not, but the stock is not keeping up with gold, which broke above its 2003 and 2004 highs.
NEM is current challenging resistance and a close above 51 would be long term bullish. The pattern looks like a sharp advance and (20-50) and long flag (35-50). A break above 51 would signal a continuation of the prior advance and project a move to around 65 (50 - 20 = 30, 35 + 30 = 65). We could also consider the trading range as a large rectangle formation and a breakout would project a move to around 65 (50 - 35 = 15, 50 + 15 = 65). Either way, a new all time closing higher for NEM would be long term bullish for both the stock and gold.