I am often asked to make an annual forecast, and I frequently oblige, but this year I'd like to take a different approach. Rather than making a "forecast," let's make an assessment of some significant factors that will be affecting market progress in 2006.
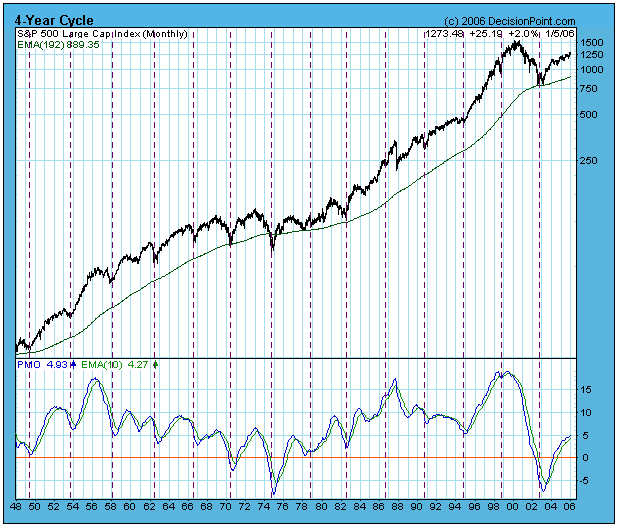
First is the 4-Year Cycle. On the S&P 500 chart below I have drawn vertical lines through the actual 4-Year Cycle troughs, as well as a few places where price troughs should have occurred but didn't. For the most part we can say that significant price lows occur every four years about 85% of the time.
Take note that the log scale causes recent price movement to be greatly under emphasized, and significant declines/lows in 1987, 1990, 1994, and 1998 appear as mere blips.
The next 4-Year Cycle price low is due in October of this year. Subordinate cycles suggest that the low may arrive a few months on either side of that projection, and there is no guarantee that the decline will play out in a straight line. For now we should be looking for some above average difficulty between now and the end of the year.
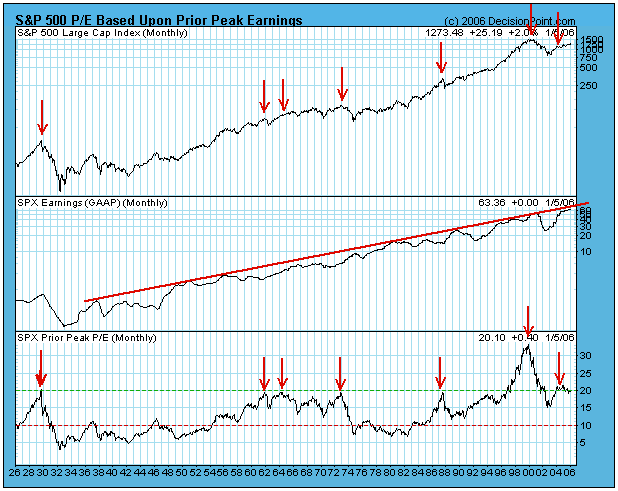
Fundamentals also present problems for the market. The next chart shows the index of S&P 500 earnings and a presentation of the P/E ratio based upon prior peak earnings, a methodology developed by John Hussman (hussman.com). As you can see, over the long term earnings have trended higher in relation to a trend line that rises at an average of about 6% a year, and the current earnings peak is very close to that trend line. This has been the situation for the last two years, and could account for the market's slow progress during that time.
Currently, the P/E has remains at a level where, except for the bubble years of 1998-2002, the market at best had trouble making forward progress, and at worst experienced major declines. This will be a significant drag on the market until the P/E can correct back toward the area of 15, which represents fair value. A correction to undervalue (10) could also happen, but that is a rare occurrence and not necessary to set up favorable conditions.
CONCLUSION: Normal cyclical expectations and high valuations present significant obstacles for the market this year, and the bull/bear cycle suggests that a significant decline will occur between now and the end of the year. That said, I should point out that Decision Point's timing models for the broad market remain on buy signals, and the trend is up. The odds favor a decline this year, but the top isn't in place yet.


