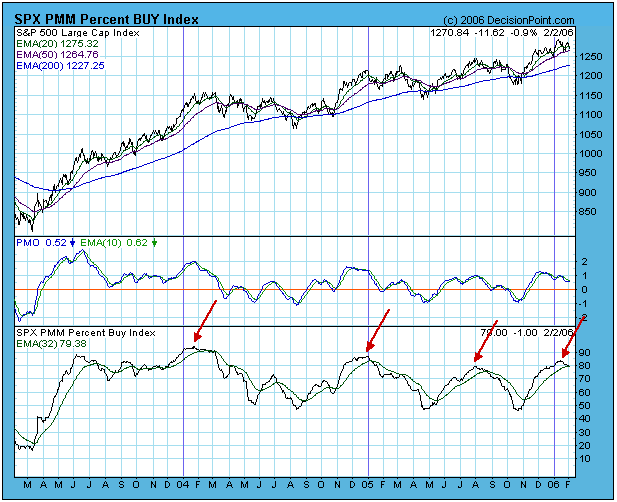
With the market having formed numerous tantalizing tops since the end of November, perhaps the title of this article should say that a correction phase is finally beginning. And, considering all those previous false starts, why am I so sure that this time is the real thing? Well, I'm pretty sure that a medium-term correction is in progress because the PMM Percent Buy Index (PBI) has turned down and crossed down through its 32-EMA. The PMM (Price Momentum Model) PBI is an important indicator that reveals the degree of bullish participation and whether that participation is getting stronger or weaker.
On the chart I have marked the current PBI top as well as three prior significant tops, which were also followed by 32-EMA downside crossovers. All three tops initiated a correction lasting from three to six months. There is no guarantee that the same thing will happen this time, but the similarity between the tops gives me a high degree of confidence in my conclusion.
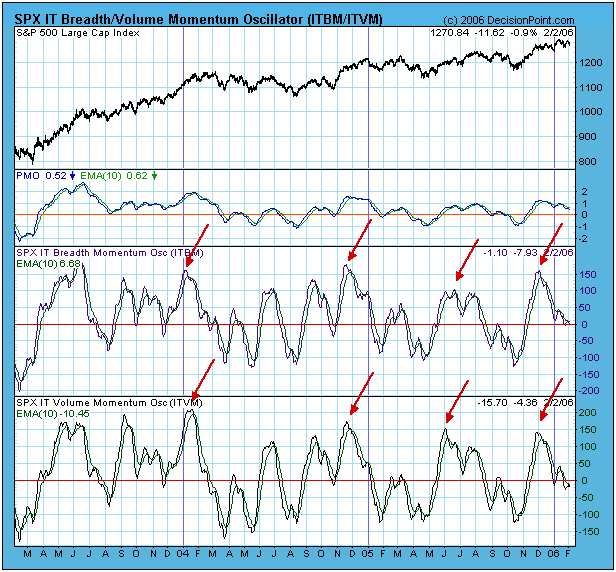
The next chart shows our IT Breadth and Volume Momentum Oscillators (ITBM and ITVM), and you can see how the market's internal strength peaked about two months ago, and these indicators gave a similar early warning for the other three corrections.
The ITBM and ITVM show that the current market condition is neutral (the indicators are near the zero line), but it is likely that they will be spending a few months working below the zero line as the market begins to correct in earnest.
There is no way to tell if the correction will be sideways or sharply down, but we are due for a cyclical bear market, and the 4-Year Cycle is pointing toward a major price low in October, so odds are in favor of a significant price decline.


