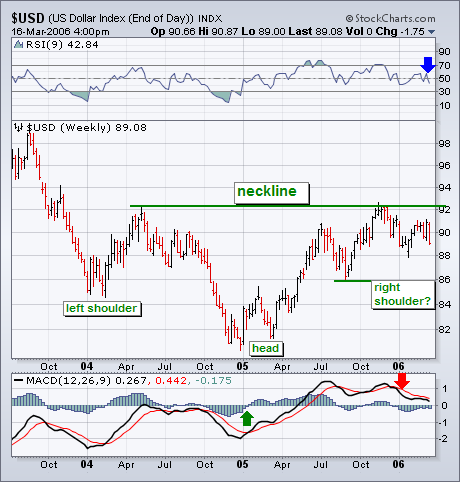
It's possible that the current dollar pullback is part of a large basing pattern of the head and shoulders variety. A case can be made that the Dollar Index formed a left shoulder at the start of 2004 and a head at the start of 2005. The fourth quarter peak near 92 stopped right at the spring 2004 peak. That allows for a neckline to be drawn over those two peaks. That interpretation allows for a drop in the USD to last summer's low near 86 as part of a possible right shoulder. That would be a fifty percent retracement of the 2005 price advance and would be a logical spot for new buying to emerge. Any severe break of last summer's low, however, would call into question the "head and shoulders" interpretation. On the upside, the Dollar Index would have to clear the "neckline" near 92 to confirm a long-term bullish breakout. Neither of those two events appears likely over the short-run. Even if the "head and shoulders" interpretation proves correct further out in time, the short-term picture for the dollar is looking weaker.