ChartWatchers

S&P 500 TESTS MAJOR UP TRENDLINE

Chip Anderson

Chip Anderson

President, StockCharts.com

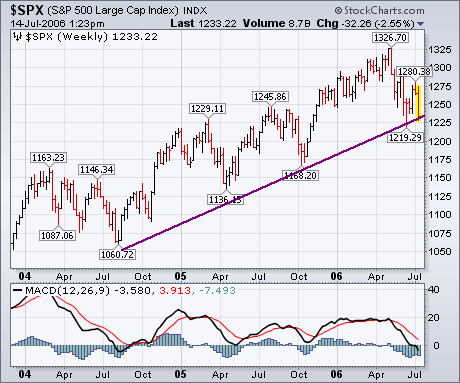
Earlier in the week I showed a number of moving averages that appeared to be on the verge of giving major sell signals. Here's another long-term support line to watch. The S&P 500 is bearing down on a two-year support line that starts in the summer of 2004. A break of that important support line would signal a drop to last October's low at 1168. That would be the first double digit percentage loss since the bull market started more than three years ago. I think the odds are pretty good that it's going to happen. The weekly MACD lines have been bearish for the last two months. This week's downturn has widened the spread between the two MACD lines which means that downside momentum is intensifying. The monthly chart is also in a very dangerous position.
:support:newsletters:2006:cww20060715m-1.png

- John Murphy

Subscribe to John Murphy's Market Message today!

Chip Anderson
About the author: is the founder and president of StockCharts.com. He founded the company after working as a Windows developer and corporate consultant at Microsoft from 1987 to 1997. Since 1999, Chip has guided the growth and development of StockCharts.com into a trusted financial enterprise and highly-valued resource in the industry. In this blog, Chip shares his tips and tricks on how to maximize the tools and resources available at StockCharts.com, and provides updates about new features or additions to the site. Learn More