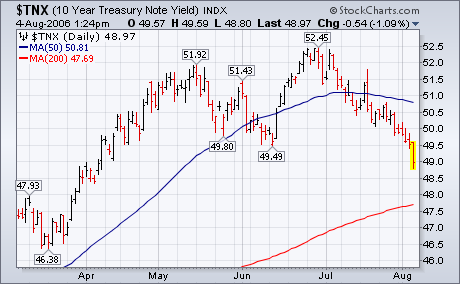
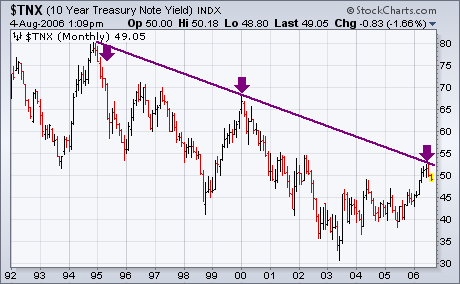
The U.S. economy added fewer jobs than expected during July and the unemployment report rose for the first time in five months to 4.8% from 4.6%. The weak job report is the latest in a string of signs that the economy is weakening. That's usually good news for bond prices which do better in a slowing economy. Technically, this is a logical spot for bond prices to start doing better and bond yields (which move in the opposite direction) to start dropping. Chart 1 is a monthly bar chart of the 10-year Treasury Note yield. The chart shows the 10-year yield testing a a major down trendline connecting the highs of 1994, 2000, and 2006. The last time I showed this chart I pointed out that this would be a logical spot for bond yields to start to weaken. And that's what they've been doing. The daily bars in Chart 2 show the reaction to today's weak news. The 10-year yield has fallen below its June low to the lowest level in four months. Besides pushing bond prices higher, falling bond yields have also given a boost to market sectors sensitive to interest rates – like banks, utilities, and REITs and to defensive stocks in general – and to safer large cap stocks (especially dividend-paying ones) at the expense of riskier smaller stocks. Falling rates are hurting the dollar which is giving a boost to gold.


