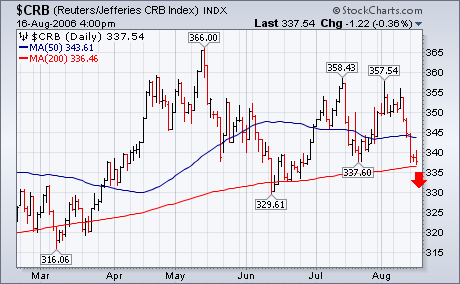
I wrote yesterday about recent selling in commmodity pits pushing the Reuters/Jefferies CRB Index into a test of its 200-day average. Today's five point drop has pushed it below that long-term support line in pretty decisive fashion (see red arrow). Chart 1 shows the CRB peaking in early May at 366 and bottoming in mid June at 329.61. The July rally attempt fell short of its May peak thereby leaving a pattern of "lower tops". Today's price drop puts the CRB in danger of breaking its June low. If it does, it will initiate a pattern of "lower peaks" and "lower troughs" which is symptomatic of a peaking market. That would be the first significant sign of a commodity top in five years. Although most commodities are falling today, the biggest weight on the CRB is coming from the energy sector.

