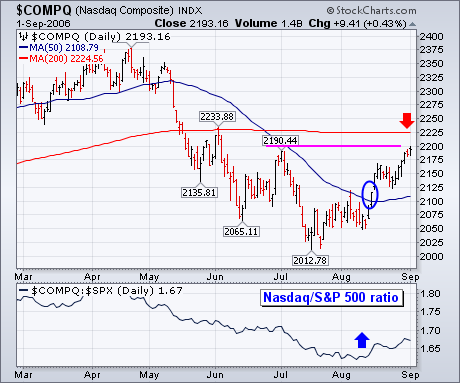
It's very hard for the stock market to stage a major advance without help from the Nasdaq market. Fortunately, it's been getting some Nasdaq help since mid-July. The chart below shows the Nasdaq Composite gaining nearly 200 points (10%) since mid-July. The actual signal of the upturn came with an upside break of its 50-day moving average (blue circle) in early August. Its rising relative strength ratio (bottom line) turned up at the same time and has been rising. That means that the Nasdaq has been leading the rest of the market higher over the last month. [The Nasdaq gained 6% during August versus 2.5% for the S&P 500 and 2.3% for the Dow]. The question is whether its recent rise can be continued. Chart 6 shows the Nasdaq moving into an overhead resistance zone ranging from its early July peak at 2190 to its 200-day moving average at 2225. Interestingly, the Nasdaq could be testing its 200-day line at the same time that the Dow and S&P 500 are testing their May highs. That will be a very important test for the market, especially as it enters the seasonally dangerous September/October time period.


