Hello Fellow ChartWatchers!

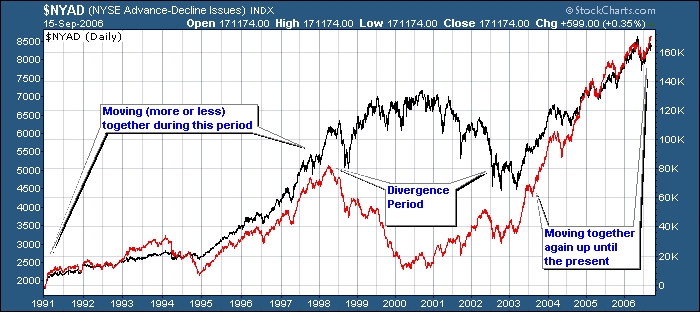
OK, do I really need to write an article explaining this picture?  Seriously, there are more than the proverbial thousand words in the chart above. The NY Advance-Decline Line (the red one) is defined as the cumulative total of the daily NYSE advancers minus the daily NYSE decliners. It is one of THE most important market breadth indicators. When it diverges from the NYSE Composite index, it signals market weakness. In late 1998, it signalled problem ahead for the internet bubble. In early 2000, the A-D Line started moving higher again, but the market didn't follow suit until mid-2002. Now the indices are moving in lock-step again. Will it last? Serious ChartWatchers check the NY Advance-Decline line at least once a week for new market signals.
To create a SharpCharts with the NY Advance-Decline line on it, plot the symbol $NYAD with the "Type" set to "Cumulative". Click the chart above to see an example. You can also use $NAAD to study the Nasdaq Advance-Decline line.


