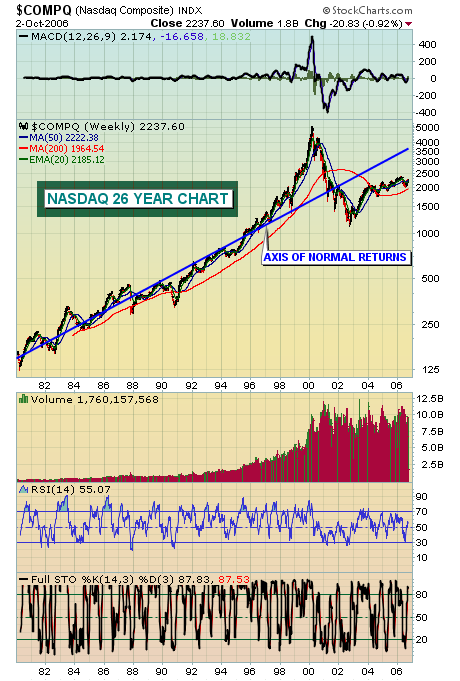
After a decent run up in stock prices, one of the questions always heard is "is it too late to buy?" Well, there's never a guaranteed right answer and a lot of analysts would say the bull market is long in the teeth and has run its course. I am not in that camp - far from it. The stock market has a history of volatility where it becomes almost euphoric near long-term market tops and utterly depressed at bottoms. Market prices move higher over time because earnings, over time, grow. But we also know that earnings can swing wildly in both directions, especially on the technology-heavy NASDAQ. Earnings multiples can expand quickly in rising markets and compress just as quickly in descending markets. So how can you truly value a market or determine whether a market is overvalued or undervalued? Let's start with the realization that the stock market is inefficient over short periods of time, but very efficient over longer periods of t ime. In the end, the market generally gets it right.
I refer to the chart below as the "axis of normal returns." It's a chart that dates back to 1980 on the NASDAQ and attempts to find the "middle of the road" in terms of market valuation, where approximately half the time the market is overvalued and the other half undervalued. The theory here is that the market goes too far in both directions and it takes time to steer it back on course. It's simple to look back and say the NASDAQ was incredibly overvalued in 2000. That doesn't matter any more though. Those days are over. The current question is, based on history, are we overvalued or undervalued NOW? Based on the chart, I'd say we're undervalued, perhaps significantly so. We've had swings above and below the "axis of normal returns", but we've always gravitated back to the normal line. I see no reason to think any different this time.
Many market pundits would suggest this bull market has run its course. I argue that what we've seen since 2002 is just the beginning of a move that takes us back to that "axis of normal returns." Time will tell who's right.


