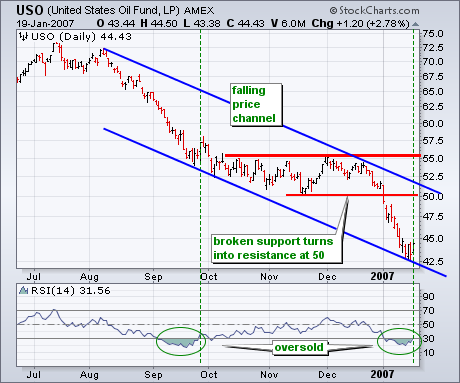
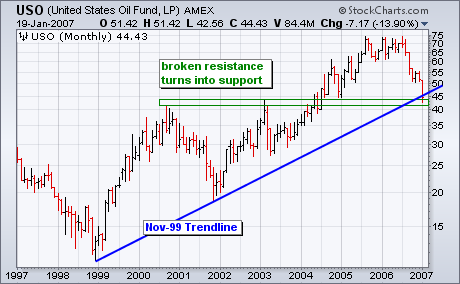
The U.S. Oil Fund ETF (USO) remains in a clear downtrend on the daily chart, but became oversold and reached long-term support on the monthly chart. The combination of oversold conditions and support argue for at least a consolidation and quite possibly an oversold bounce back to broken support at 50.
On the daily chart, I am using RSI to identify oversold conditions. RSI moved below 30 (oversold) in early January and stayed oversold until Friday (19-Jan). The indicator is making a move back above 30 and this is the first positive sign in 2007. Before getting too excited, notice that RSI was oversold all of September and moved above 30 in October. However, USO traded flat and there was not much of a bounce until late November. A bounce could take time.
In addition to oversold conditions, I see reason to expect support around 42-45. For the falling price channel, I drew the upper trendline first and the lower trendline is parallel to this trendline. The lower trendline extends to around 42.5 and this trendline acts as support. USO firmed between 42.5 and 45 this week to affirm channel support. The monthly chart also confirms support around 42.5 with the Nov-99 trendline and support from broken resistance.


