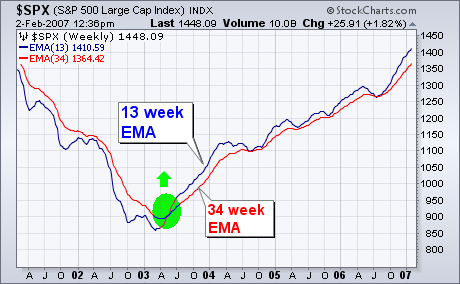
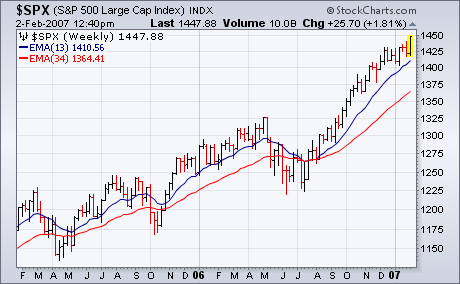
Last July, I reviewed a moving average technique that used weekly exponential moving averages. [I first described this system in October 2005]. I'm revisiting it today because it continues to do remarkably well. And I'd like to suggest expanding its usefulness. The technique is a moving average crossover system. In other words, trading signals are given when the shorter m.a. line crosses the longer. The two moving averages are the 13 and 34 week exponential moving avarages (EMAs). [EMAs are more sensitive than simple moving averages because they give greater weight to more recent price data]. Chart 1 shows the two lines over the last six years for the S&P 500 (absent the price action). Only one crossing (signal) has taken place in those six years. That was a bullish crossing in the spring of 2003 just as the new bull market in stocks was beginning (green circle). Although the two lines converged four times during the four year bull market, the 13 week EMA has never crossed below the 34 EMA. Chart 2 overlays the weekly S&P 500 bars on the two EMA lines for the last two years. The S&P dipped below both lines during the last three market corrections. That doesn't matter. What does matter is that the two moving average lines didn't cross.


