The recent focus of the equity markets is upon the "sub-prime" mortgage problem; and upon the "yen-carry trade". We think both are valid concerns; however, the question of the "yen-carry trade" is more important in our mind than the "sub-prime implosion." Perhaps the sub-prime problem is the "catalyst" to start the correction ball rolling, while the "yen-carry" is the horse that does the heavy-pulling, and the heavy-pulling in this regard is a correction that takes stocks back to more traditional oversold levels.
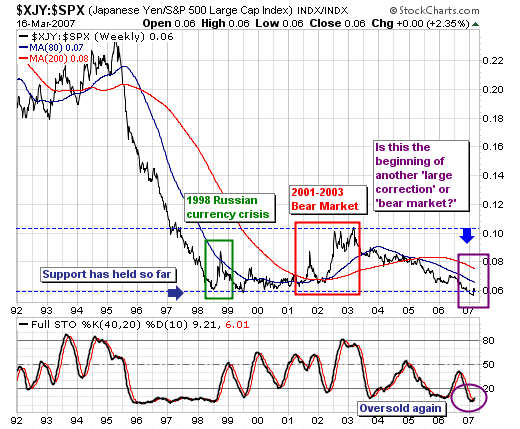
That said, looking at the Yen-S&P 500 ratio, we find two clear periods in the past decade - one short and one long - where the yen rose against the S&P. And in both cases, when the yen was rising against the S&P 500, the S&P 500 was in an absolute correction. The first period was short, and coincided with the 1998 Russian currency crisis, which took the S&P lower by -22%; whereas the second period was more prolonged and coincided with the technology "bubble". The result was quite a larger bear market with the S&P dropping 50%. Thus there is precedent for a larger decline coincident with a rising ratio.
Hence we must be concerned given the ratio is starting to show nascent signs of wanting to rally once again. The initial "spike higher", coupled with the oversold 40-week stochastic certainly concerns us. Moreover, the yen is right upon its 80-week trading moving average, of which a break above it would be the first time it has closed above it since 2005. Obviously, this would usher in higher yen prices. So, we think the ratio rally continues, and we clearly believe stocks will falter.
And in ending, this begs the question as to just how "deep" a correction are we looking at. If we simply look at the weekly and monthly S&P charts, we find major weekly support crosses at 1330...or its 80-week moving average. Monthly support however, is at the 40-month moving average, which crosses at 1230. Therefore, we think it would be rather reasonable for a test of this zone to occur; of which the total decline off the high would be roughly -9% and -16% respectively. Normal corrections on the order of -10% are common; hence we are willing to split the zone difference leaving our target at roughly S&P 1280. Obviously, this means are are selling rallies.