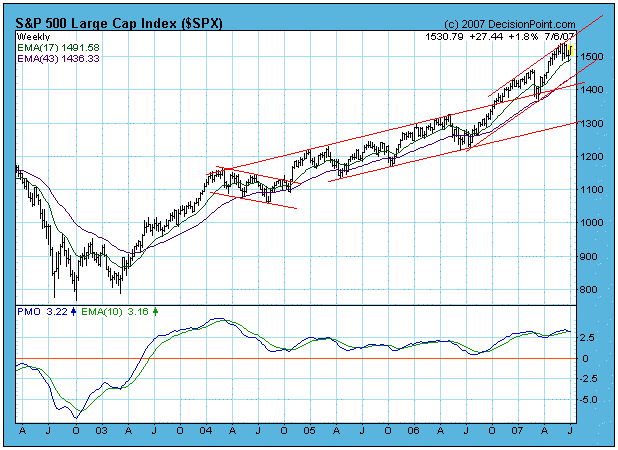
When performing market analysis it is best to first look at the long-term view of what is happening because it provides us with the relevant context for analysis of shorter-term market action. With this in mind, on the weekly bar chart we can see that the S&P 500 Index is still trending higher inside a rising trend channel. However, at the present time it is moving down after having reached the top of the channel. While this could very well be the last top before a major decline, we are in a bull market and we have to assume any decline will be stopped by the rising trend line.
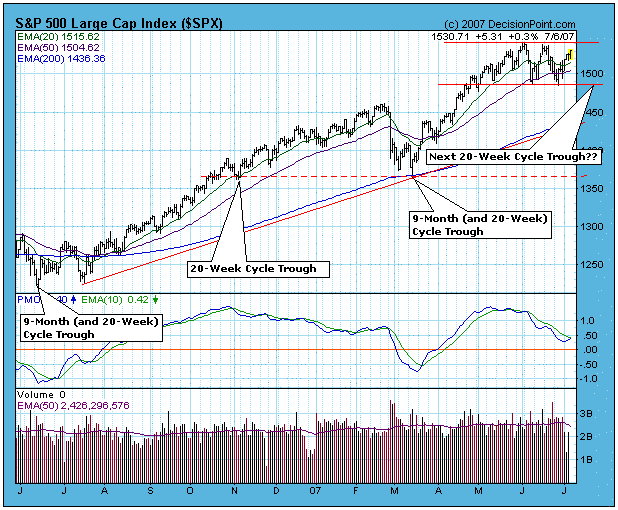
On the second chart we move in for a closer look, and we can see that prices have been consolidating for more than a month. Will this consolidation resolve as a double or triple top, or is it building a base for another leg upward? After looking at my cycle projections, I can imagine one scenario that we might see.
The March low was a 9-Month Cycle trough. The next subordinate cycle within the 9-Month Cycle is the 20-Week Cycle – there are two of them in a 9-Month Cycle. It appears that the market is now in the process of cresting in preparation for a decline into the next 20-Week Cycle trough, which is projected to arrive at the end of this month.
It is important to understand that you cannot set your watch by cycle projections, and we cannot know precisely what kind of price pattern will emerge, but cycle projections provide an intuitive framework for interpreting market action. For now I think we should be looking for a down thrust that may ultimately prove to be the current 20-Week Cycle trough. It could have happened already, or it may not happen for several weeks, but we are in the "window".
What I think may happen is that a decline in the next few weeks will break down through the support at the bottom of the consolidation range, leading very quickly to the cycle trough. Such a breakdown would likely prove to be a bear trap because of the likelihood of an upside reversal out of that trough as the next 20-Week Cycle begins.
Bottom Line: Please understand that this is just an educated guess, but a guess nonetheless. There are many other ways this could play out, but my main point is to emphasize that the next 20-Week Cycle trough is more likely to be a buying opportunity than the beginning of a serious decline. I'm not suggesting that you try to pick the bottom, just be alert for the possibility and use your standard entry techniques.


