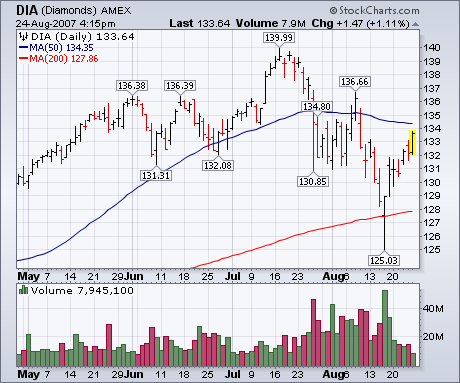
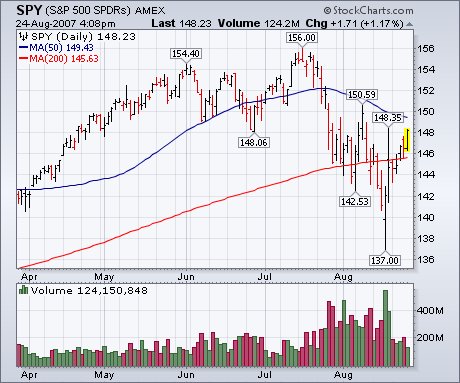
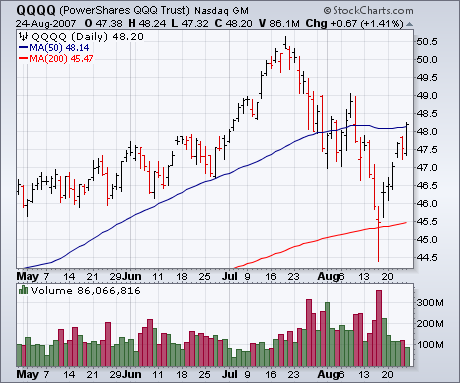
Friday's higher prices continued the market rally that started the previous Thursday. The three charts below show major market ETFs all back above their 200-day moving averages, which removes any immediate threat of a bear market. All have recovered more than half of their July/August decline, The Dow Diamonds and the S&P 500 SPDR are now in position to test their falling 50-day lines. Since a market bounce that could last two to four weeks was expected, this week's bounce doesn't tell us if the worst is over or if there's another downswing to come (that could at least retest the recent lows). One important thing missing from the rally is volume. All three charts show remarkably light trading this past week. In fact, today's trading was the lowest since the days surrounding the July 4 holiday. Chart 3 shows the PowerShares QQQ Trust (QQQQ) closing slightly above its 50-day line today. Unfortuntely, that also came on unusually low volume. Low volume tends to exaggerate price moves and shows little buying enthusiasm. That's especially true on a Friday afternoon in August.