The "surge" of the past month in the S&P 500 is nothing short of astounding; and given the technicals involved – we believe prices are set to continue moving higher with a projection to 1630 into the October-December time frame. This represents a +6.8% rally from the Friday, September 21 close.
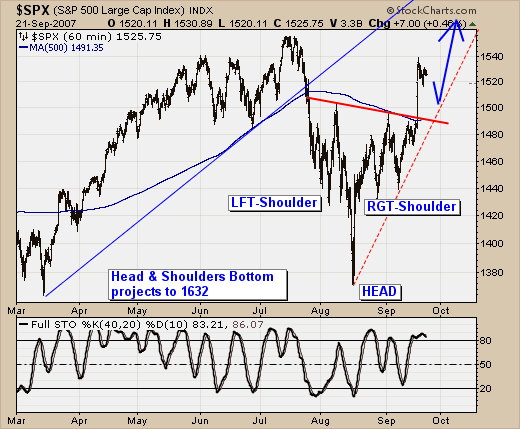
Quite simply, when we look at the S&P 500 hourly chart; we find a very picturesque "head & shoulders" bottoming pattern that was confirmed with the breakout above neckline resistance at 1496. Our target is arrived at using the percentage gain +9.1% off the 1371 low to neckline resistance at 1496, and then applying the gain to 1496 to arrive at 1632.
The question before all of us is "how do we get there", and what sectors will outperform and which will underperform. This is important as we believe an "important top" will form at 1632 given the current advance/decline line of NYSE "operating companies only" is lagging rather badly on the rally thus far. Typically, the advance/decline line tops out 4-6 months before prices do so; which occurred in June-2007. Hence, our target time frame of October-December 2007.
And finally, we'll also note that the hourly "head & shoulders" bottom 1632 target roughly converges with the weekly "head & shoulders" bottom breakout in 2004 that targets 1650; and speed-line resistance off the September-2001 bottom connecting the January-2004 high and the June-July 2007 highs. Attention is to be paid when various methods of technical analysis converge; and we are doing so.